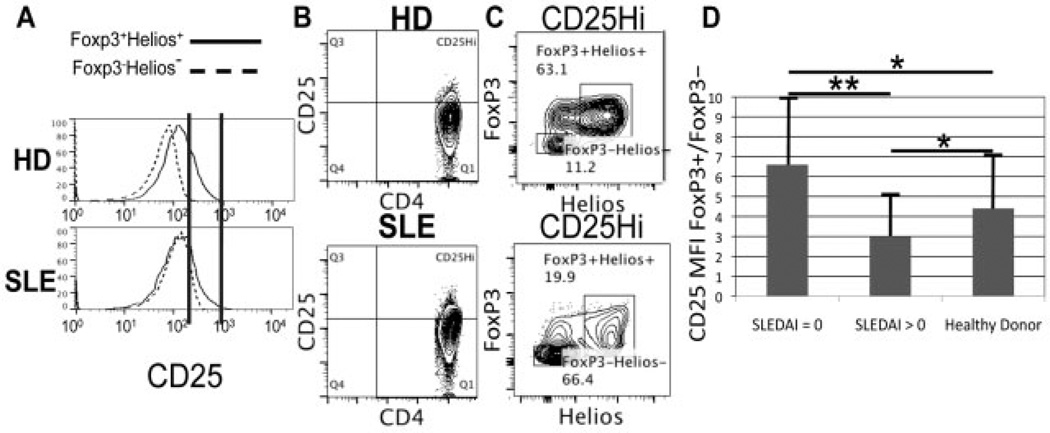
Figure 2.
CD25, a poor marker of Treg cells in systemic lupus erythematosus (SLE). Representative histograms and fluorescence-activated cell sorter (FACS) plots for cells from 12 healthy donors (HD) and 19 SLE patients are shown. A, CD4+ T cells gated on FoxP3+Helios+ (Treg cells) or Helios−FoxP3− (conventional T cells), showing relative CD25 expression. Vertical lines indicate CD25 expression levels that overlap between FoxP3+Helios+ and FoxP3−Helios− cells in SLE patients but not healthy donors. B, FACS analysis of total peripheral blood mononuclear cells, showing gating strategy for the CD4+CD25high subset based on the CD25 histograms shown in A. C, Helios and FoxP3 expression in the gated CD4+CD25high subset shown in B. D, Ratio of the CD25 mean fluorescence intensity (MFI) in FoxP3+ versus FoxP3− CD4+ T cells in 8 patients with inactive SLE (Systemic Lupus Erythematosus Disease Activity Index [SLEDAI] score of 0), 11 patients with active SLE (SLEDAI score of >0), and 12 healthy donors. Values are the mean ± SD. * = P > 0.05; ** = P < 0.05 by Student’s unpaired t-test.

