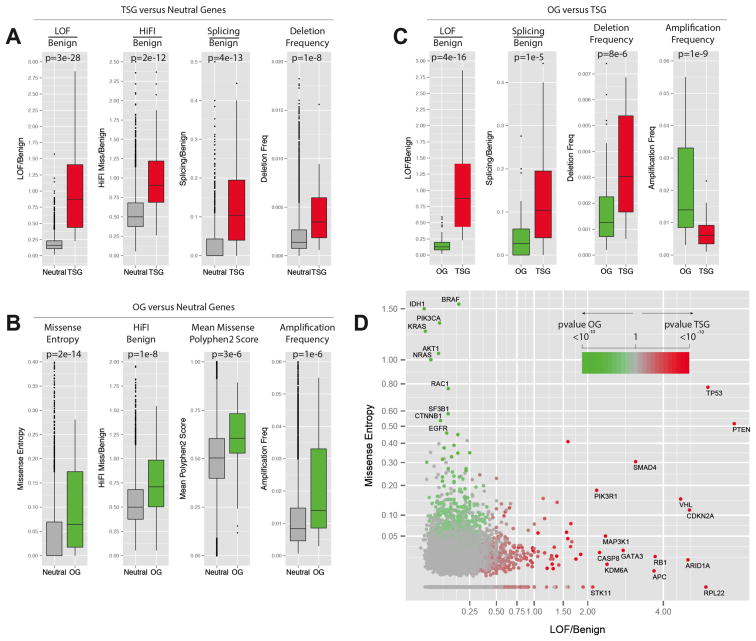
Fig. 2. Best parameters selected by Lasso for the prediction of TSGs and OGs.
Panels A–C contain a boxplot representation of the distribution of the values for the indicated parameters in the indicated Neutral genes (grey), TSG training set (red) and OG training set (green). The median, first quartile, third quartile and outliers in the distribution are shown. The p-value for the difference in the two indicated distributions is shown as derived by the Wilcoxon test.
A) Boxplots showing the distribution of LOF/Benign, HiFI missense/Benign, Splicing/Benign ratios and the high frequency of focal deletion among the Neutral gene set and the TSG.
B) Boxplots showing the distribution of Missense Entropy, HiFI missense/Benign, mean of PolyPhen2 score and the high frequency of focal amplification among the Neutral gene set and the OGs.
C) Boxplots showing the distribution of LOF/Benign, Splicing/Benign ratios, high-frequency of deletion and high frequency of amplification among the TSG and OG sets.
D) Plot of the LOF/Benign ratio and Missense Entropy for each gene, the best parameters for discriminating between TSGs and OGs. Specific genes with high levels of LOF/Benign or Entropy Missense are shown along with their p-value for being a TSG or an OG (TUSON Explorer).
Also see Supp. Fig. 2 and Supp. Table 2.

