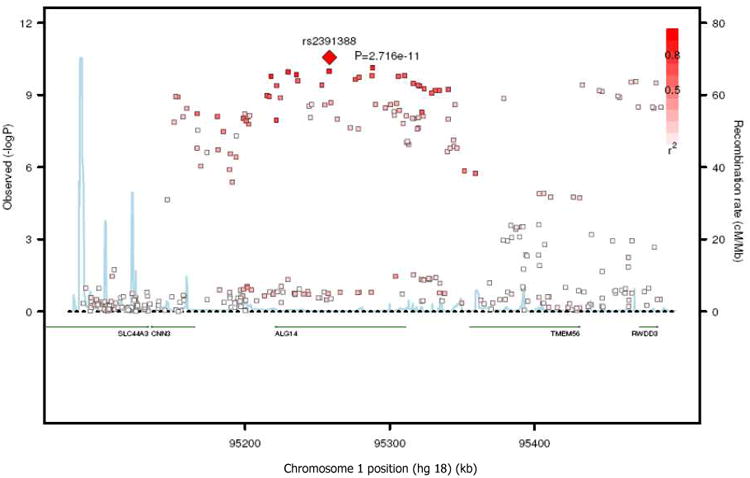
Figure 3.

SNP association plots for palmitic acid-associated region. Genetic coordinates are along the x-axis (as per NCI build 36) and genome-wide association significance level is plotted against the y-axis as −log10(P-value). LD is indicated by color scale in relationship to marker rs2391388, with red for strong linkage disequilibrium (LD; r2 ≥0.8) and fading color for lower LD.
