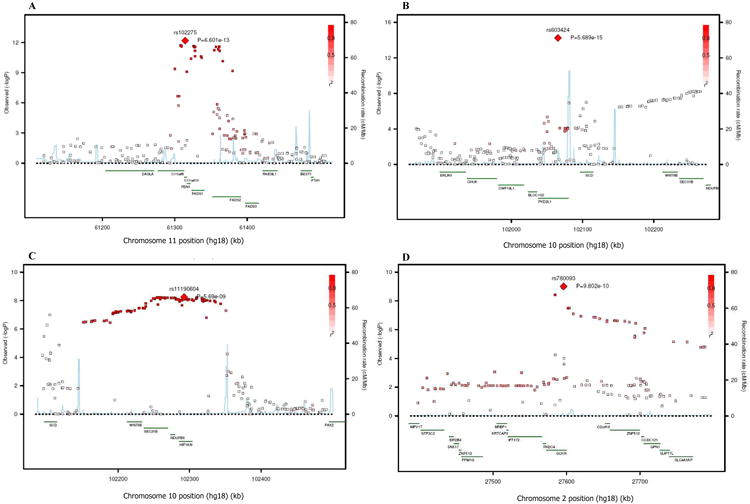
Figure 6.

SNP association plots for palmitoleic acid-associated region. Genetic coordinates are along the x-axis (as per NCI build 36) and genome-wide association significance level is plotted against the y-axis as −log10(P-value). (A) FADS cluster region. LD is indicated by color scale in relationship to marker rs102275. (B) PKD2L1 cluster region. LD is indicated by color scale in relationship to marker rs603424. (C) HIF1AN cluster region. LD is indicated by color scale in relationship to marker rs11190604. (D) GCKR cluster region. LD is indicated by color scale in relationship to marker rs780093. The color scheme is red for strong linkage disequilibrium (LD; r2 ≥0.8) and fading color for lower LD.
