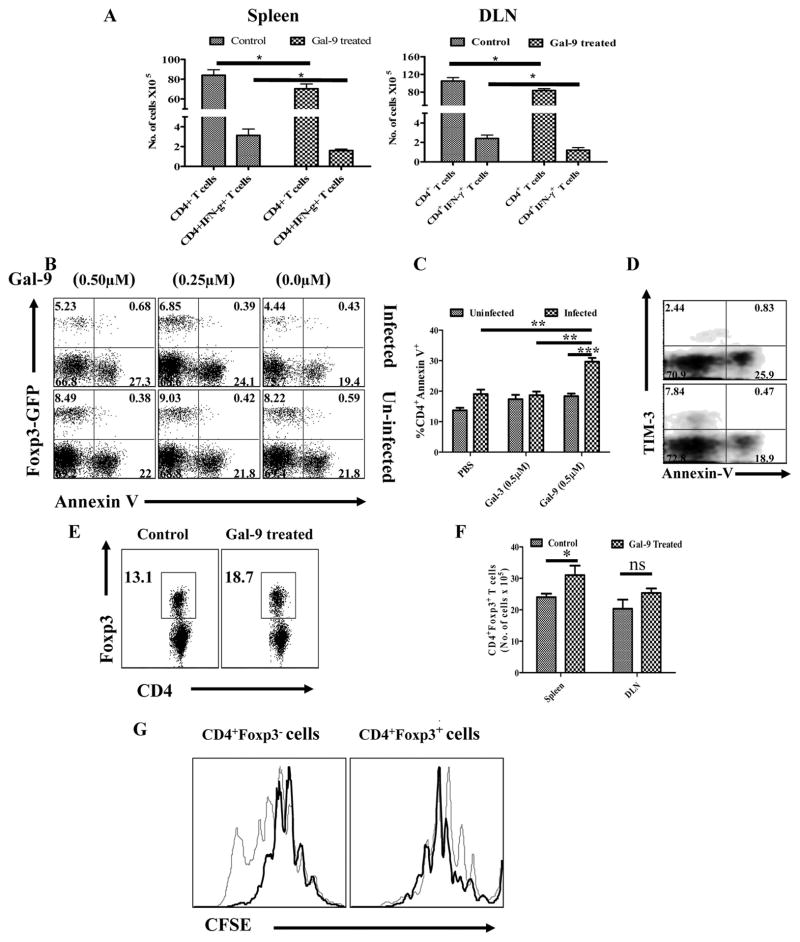
Fig. 5. Differential effects of galectin-9 therapy on regulatory T cells and effector CD4+ T cells in HSV infected animals.
A. Total numbers of CD4+ T cells and CD4+IFN-γ+ T cells in the DLNs and spleens of control and galectin-9 treated (systemic) animals in shown. B–D. Induction of apoptosis of CD4+Foxp3−TIM-3+ T cells by galectin-9. Cells isolated from cervical LNs of HSV infected Foxp3-GFP knock in animals (day 8) and uninfected animals were cultured in the presence of PBS, galectin-3 and galectin-9 for 8 hours and thereafter stained for annexin-V, B. Annexin-V+CD4+Foxp3− and Foxp3+ T cells isolated from infected (upper panel) and uninfected (lower panel) animals incubated with PBS and galectin-9 animals is shown. C. The bar diagram showing the percentages of annexin-V+ cells under indicated conditions is shown. D. Co-staining of CD4+ T cells for annexin-V and TIM-3 is shown. E–G. Proliferative responses of Foxp3- and Foxp3+CD4+ T cells in HSV infected animals after galectin-9 therapy. Frequencies (E) and absolute numbers (F) of CD4+Foxp3+ T cells in the spleens (E and F) and DLNs (F) of control and galectin-9 treated animals are shown. G. DLN cells isolated from control and galectin-9 treated animals were labeled with CFSE and their proliferative response in the presence of anti-CD3 and anti-CD28 were analyzed after 3 days. CD4+ gated population analyzed for the dilution of CFSE in Foxp3+ and Foxp3− CD4+ T cells from control (thin line) and galectin-9 treated (thick line) animals is shown.

