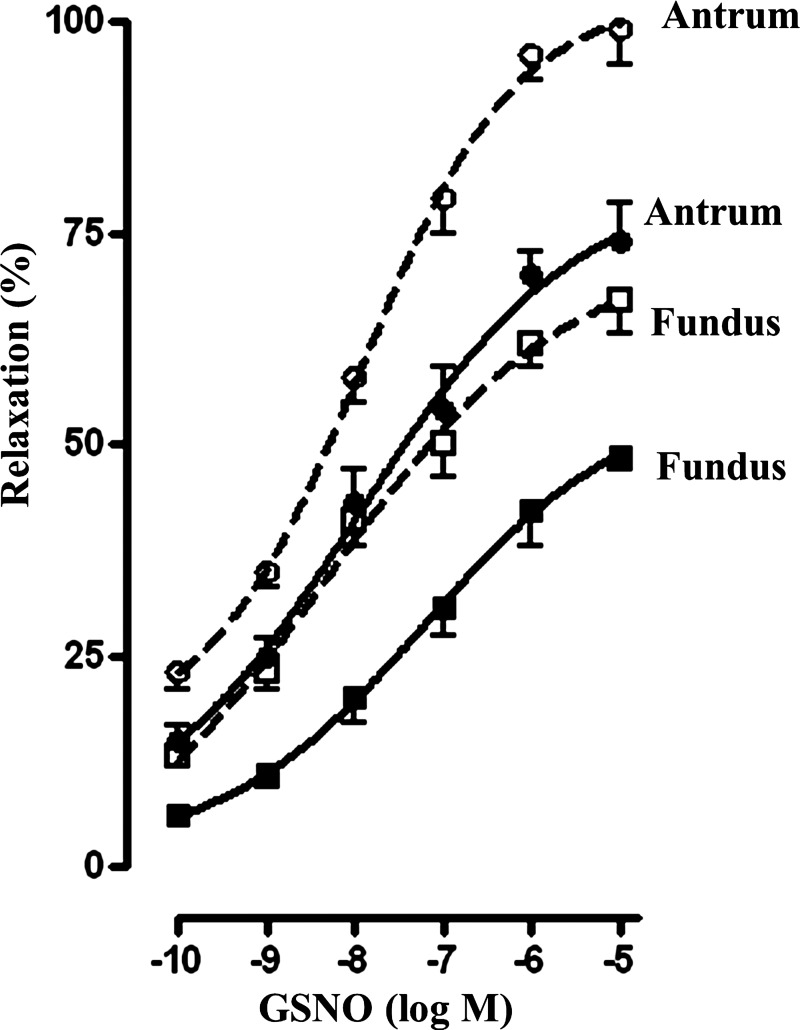
Fig. 8.
GSNO-induced muscle relaxation. Relaxation of dispersed muscle cells from antrum and fundus in response to different concentrations of GSNO was measured by scanning micrometry as decrease in ACh-induced contraction. In some experiments effect of GSNO was examined in the presence of probenecid (200 μM) and IBMX (100 μM) (dashed lines). Contraction was measured in response to maximal concentrations of ACh (0.1 μm) at 30 s as decrease in control cell length (antrum: control cell length 98 ± 3 μm; fundus: control cell length 91 ± 4 μm). Contraction was similar in muscle cells from antrum (28 ± 3% decrease) and fundus (29 ± 2% decrease). GSNO-caused relaxation was concentration dependent in both antrum and fundus and the relaxation was greater in antrum compared with fundus. Values represent means ± SE of 4 separate experiments.

