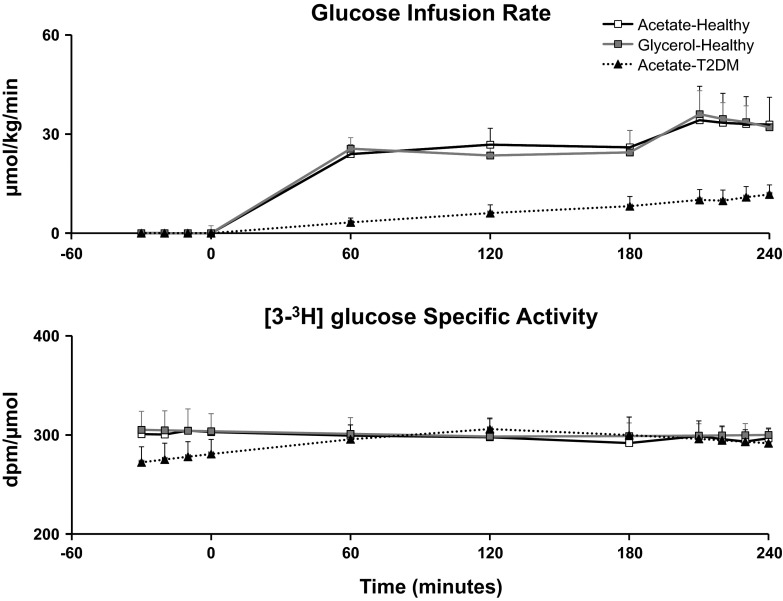
Fig. 5.
Top: glucose infusion rate required to maintain target glucose concentrations (∼10 mM) during [1-13C]acetate infusion in healthy (□) and T2DM subjects (▲) and [U-13C]glycerol infusion in healthy subjects (gray squares). Bottom: plasma [3-3H]glucose-specific activity during [1-13C]acetate infusion in healthy (□) and T2DM subjects (▲) and [U-13C]glycerol infusion in healthy subjects (gray squares).

