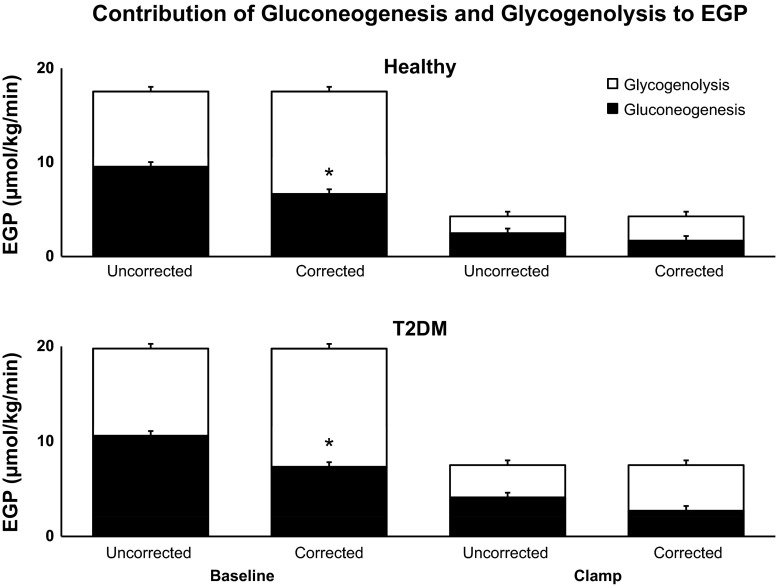
Fig. 7.
Contribution of gluconeogenesis (black bars) and glycogenolysis (open bars) to endogenous glucose production (EGP) observed during [1-13C]acetate infusion before and during the clamp in healthy and T2DM subjects, calculated using the uncorrected and corrected ratios of the deuterium enrichment on position 5 and position 2 of plasma glucose. *P < 0.05 vs. uncorrected gluconeogenesis.

