Figure 6.

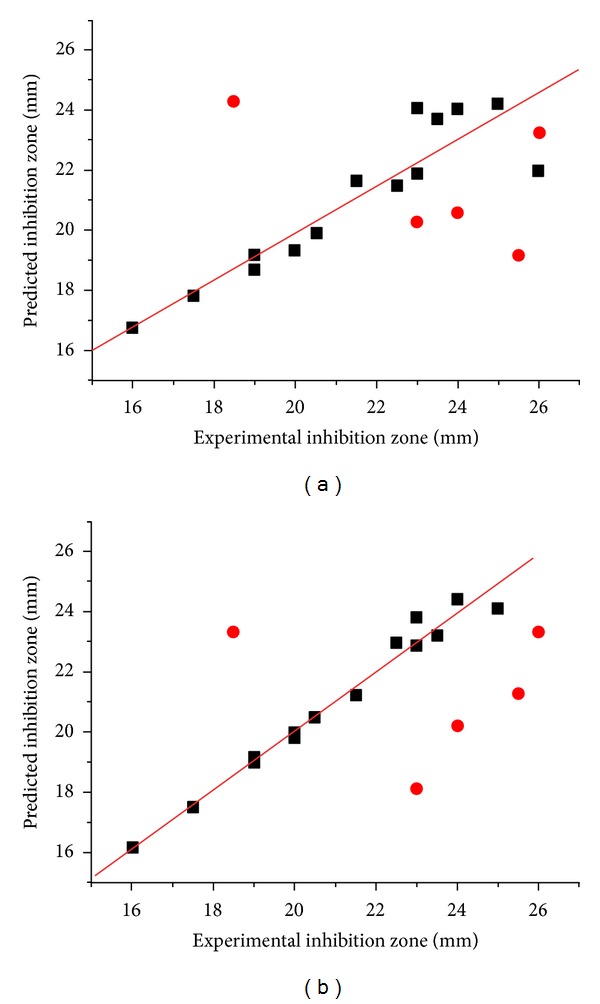
Plots between the experimental and predicted biological activities of training (filled square) and test set (filled circle): (a) CoMFA plot and (b) CoMSIA plot.

Plots between the experimental and predicted biological activities of training (filled square) and test set (filled circle): (a) CoMFA plot and (b) CoMSIA plot.