
Fig. 4.
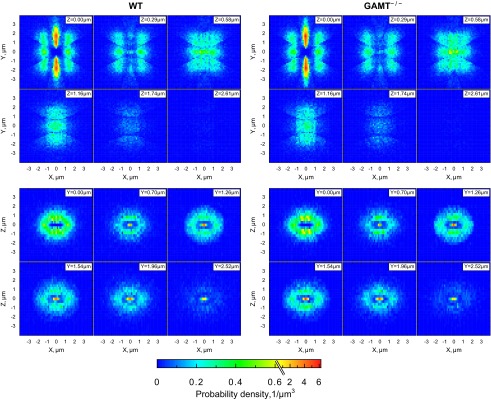
Probability density of the closest mitochondrial centers in each of the directions in WT (left) and GAMT−/− (right) cardiomyocytes. A total of 24,588 (WT) and 23,405 (GAMT−/−) mitochondria from 6 cells were analyzed. Each mitochondrial center was considered to be in the origin (0, 0). The space around was divided into 14 sectors, and the distribution of the closest mitochondrial centers in each sector was analyzed. Results from sectors with the same direction were pooled. Here, and in the following analysis, the y-direction was taken along the myofibrills and x- and z-directions were transversal directions at and perpendicular to the image planes, respectively. The xy- and yz-directions were diagonal directions. Two-dimensional probability density is shown at different planes perpendicular to the z-axis (XY-planes; top) or the y-axis (XZ-planes; bottom) at different distances from the origin as indicated at the top right corner of each plane. Note how similar the mitochondrial distributions were in GAMT−/− and WT cardiomyocytes.