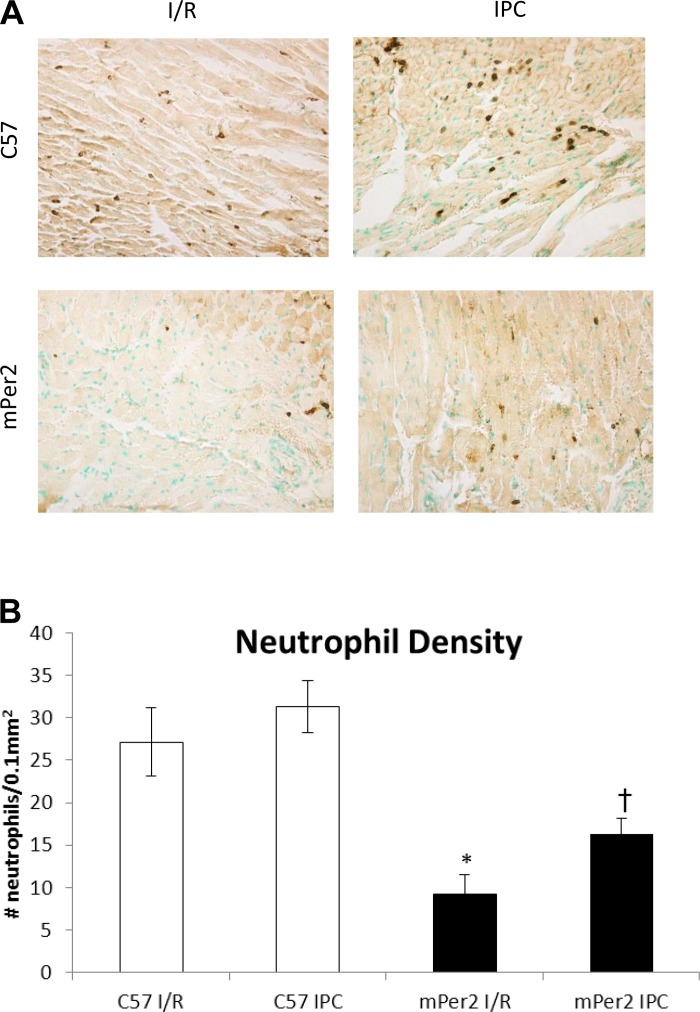
Fig. 2.
Neutrophil density in the infarct zone. The images in A illustrate the density of neutrophils in the infarct zone of mouse hearts from C57 and mPer2-M mice exposed to either I/R or IPC (×400). The graph in B shows that the relative density of neutrophils (Ly6G+-labeled cells) per 0.1 mm2 of the infarcted area was decreased 67% in mPer2-M I/R compared with WT I/R (*P < 0.001) and 48% in mPer2-M IPC vs. WT IPC (†P < 0.01), but there were no differences between I/R and IPC in the WT hearts or the mPer2-M hearts.

