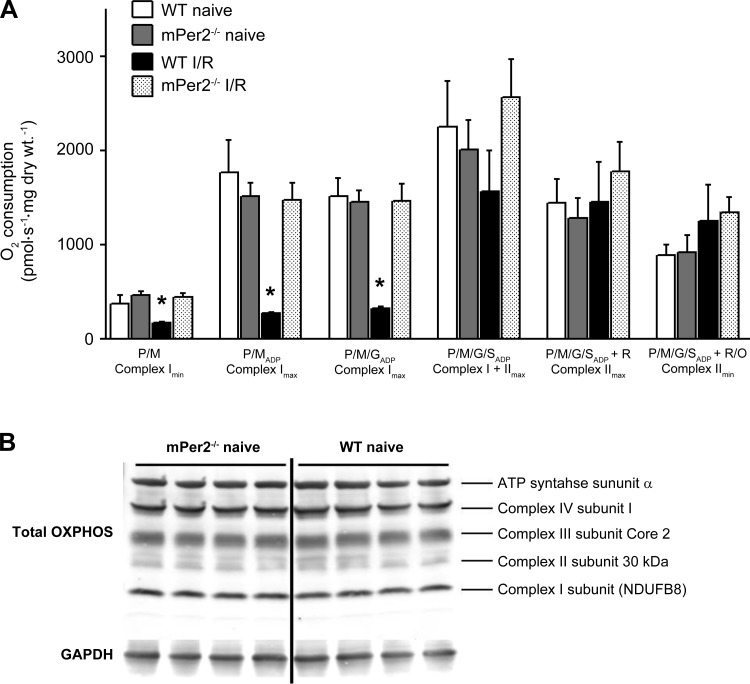
Fig. 6.
Mitochondrial O2 consumption and respiratory protein content. Rates of mitochondrial O2 consumption in the presence of 5 mM pyruvate/2 mM malate (P/M, Complex Imin); P/M + 5 mM ADP (P/MADP, Complex Imax); P/MADP + 5 mM glutamate (P/M/GADP, Complex Imax); P/M/GADP + 5 mM succinate (P/M/G/SADP, Complex I + IImax); and P/M/G/SADP + 1 μM rotenone (Complex IImax) are shown in A. Shown in B are representative immunoblots (n = 4) of mitochondrial respiratory enzyme subunits of complexes I-IV + complex V (H+-ATPase) in naïve mPer2−/− and WT myocardium; Values are means ± SE (n = 5). *P < 0.01 vs. all other groups for that condition.

