Fig. 3.
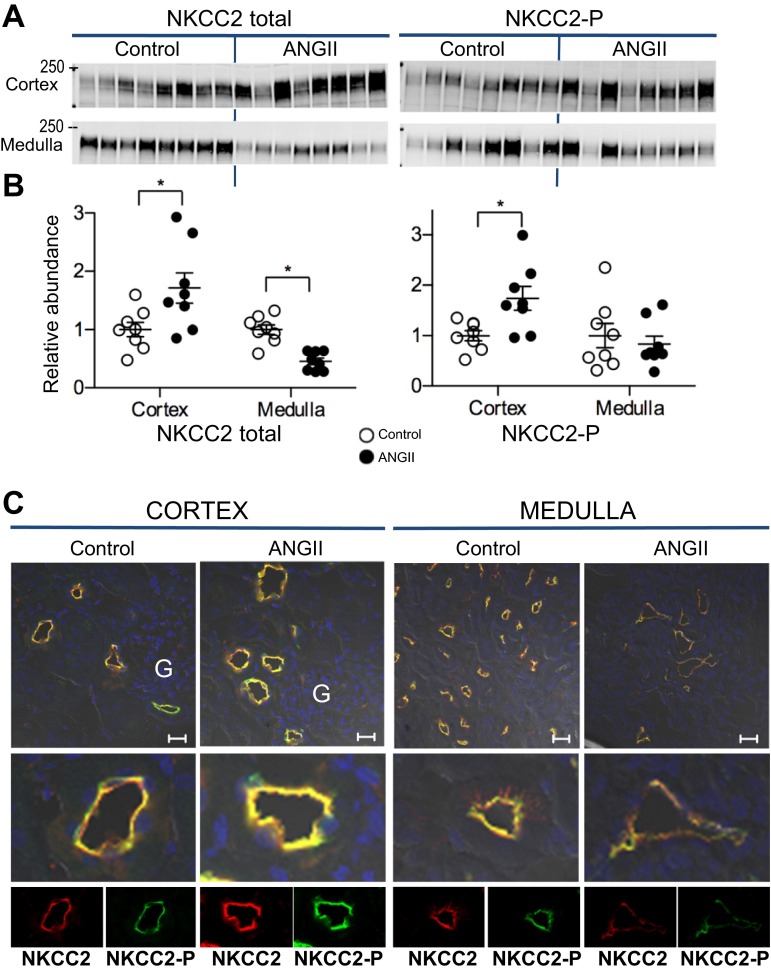
ANG II infusion provokes differential regulation of NKCC2 in cortex vs. medulla. A: immunoblots of total NKCC2 and NKCC2-P in cortex and medulla of rats infused with either vehicle (control) or ANG II (n = 8 each). Protein per lane in Table 1. B: relative abundance displayed as individual records with means ± SE. *P < 0.05. C: indirect immunofluorescence microscopy of NKCC2 and NKCC2-P. Kidneys from 2 rats were fixed for each condition. Sections were processed identically on same slide and imaged with the same settings. Two sections were fully examined and the representative images were chosen with glomeruli for identification of the cortex. Antibody labeling specifics provided in Table 1. Bar, 20 μm. G, glomerulus.

