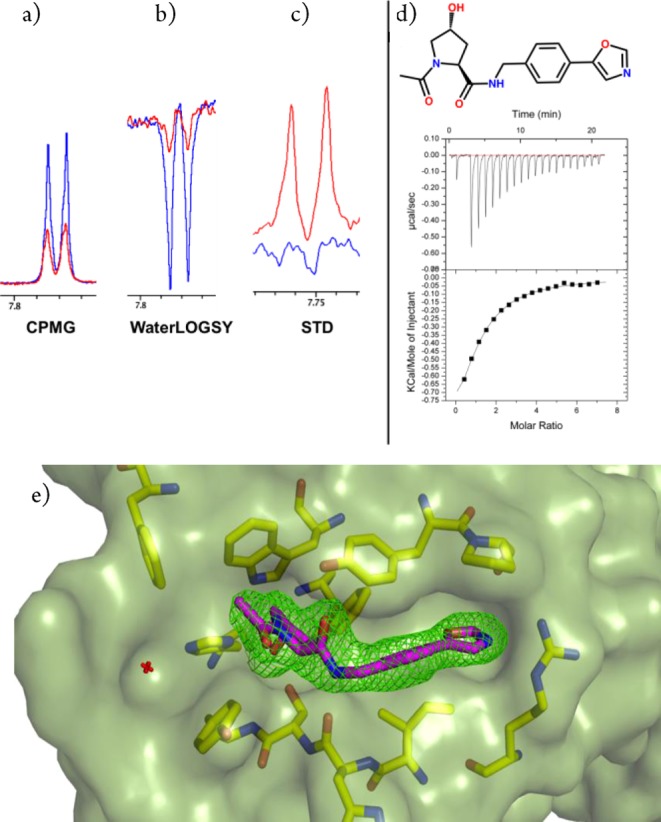
Figure 2.

Binding detection at the pVHL:HIF-1α interface for 4. (a–c) NMR spectra for VCB + 4 using set-up 1 (red) and the compound alone (blue). (d) Direct ITC titration for 4 (3 mM compound and 100 μM VCB). Data was fitted with Ka = 6.7 × 10³ ± 400 M–1; ΔH = −1450 ± 100 cal/mol; and ΔS = 12.6 cal/mol/degree. (e) Crystal structure of VCB in complex with 4 (purple carbon sticks). The omit electron density maps (Fo – Fc) are shown in green contoured at 2.5σ around the ligand. The protein surface is shown in green at 40% transparency.
