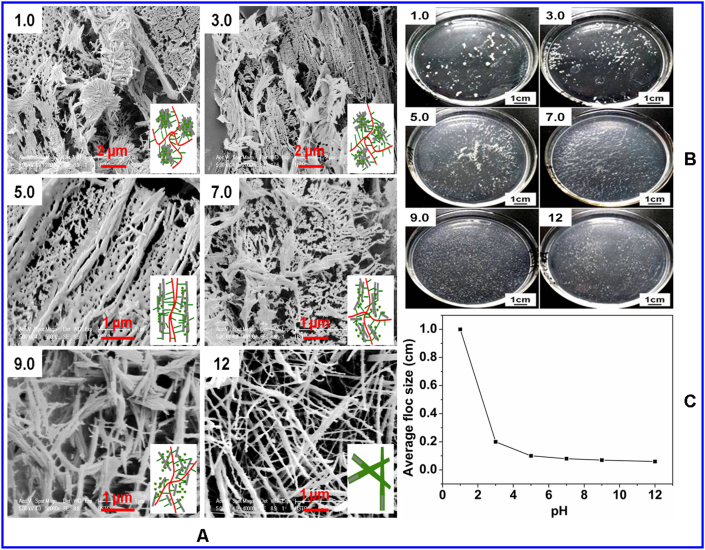
Figure 3. Morphology of LCU flocs under different pH conditions.
(A), SEM images of LCU (1 g/L) flocs under different pH conditions. Insets were the schemes of the corresponding structures (gray, red and green imply ATP rod, molecular assemblies of P and molecular assemblies of U respectively). (B), Digital photographs of LCU flocs in aqueous solutions at different pH values. (C), Average spatial scale (image method) of LCU flocs under different pH conditions.

