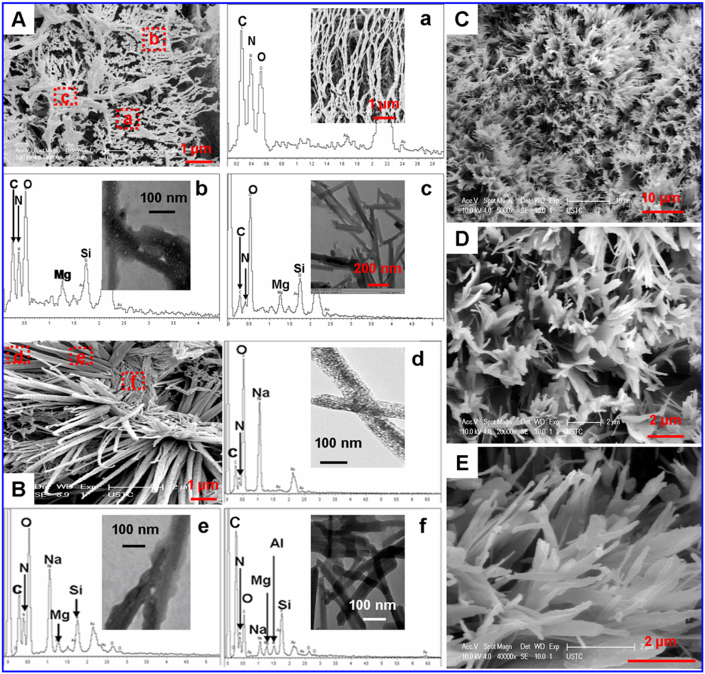
Figure 4. Morphology and EDX analysis of LCU flocs.
(A–E), SEM images of LCU flocs under pH conditions of 7.0 (A) and 12 (B–E) with different magnification. (a–c) and (b–f), Main elements (EDX analysis) contained in the corresponding micro regions in (A) and (B) respectively. Insets are SEM (a) or TEM (b–f) images for the corresponding micro regions.

