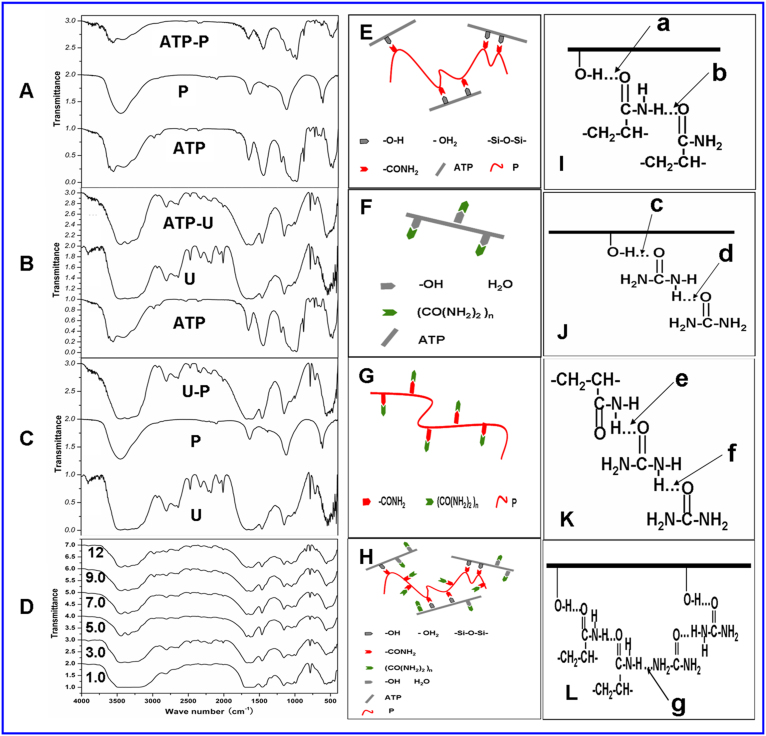
Figure 5. FTIR analysis of ATP-P-U system (actually LCU).
(A–C), FTIR spectra of ATP-P, ATP-U and U-P systems prepared at pH 7.0. (D), FTIR spectra of ATP-P-U system prepared under different pH conditions. (E–L), Schemes of hydrogen bonds in ATP-P (E, I), ATP-U (F, J), U-P (G, K) and ATP-P-U (H, L) systems, respectively. (a–g), Hydrogen bonds.

