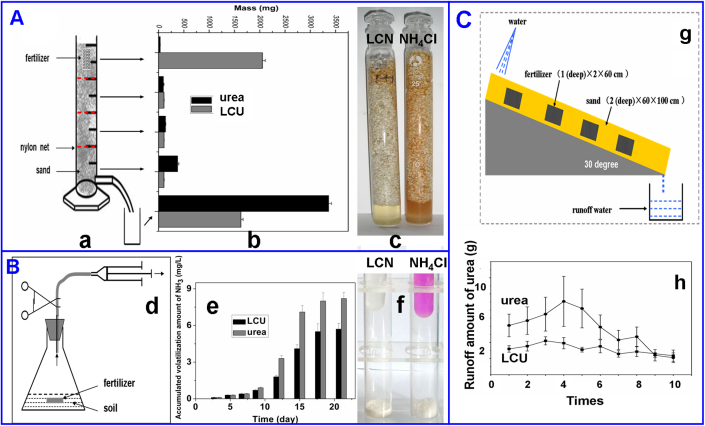
Figure 6. Loss control performance of LCF through leaching (A), volatilization (B) and runoff (C).
(a), Sand column. (b), Residue amounts of LCU in each sand layer after leaching compared with urea. (c), Migration performance of loss control NH4Cl (LCN) and NH4Cl in perlite columns. (d), Volatilization determination system. (e), Accumulated NH3 volatilization amounts of LCU and urea with time. (f), NH3 volatilization capacity difference between LCN and NH4Cl. (g), Runoff determination system. (h), Urea loss amounts of LCU and urea with runoff times.

