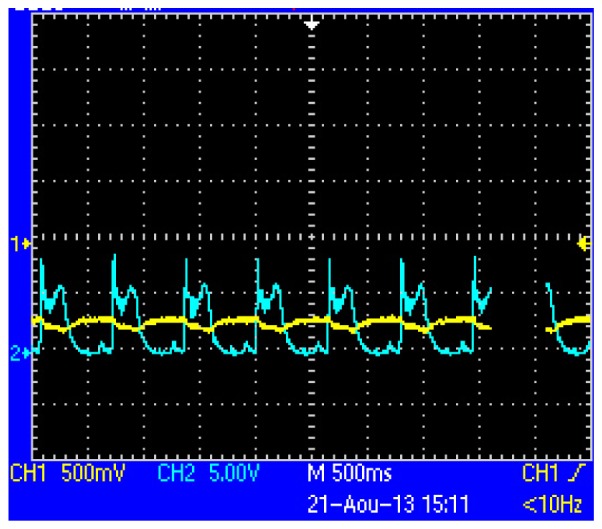
Fig. 5.

A sample oscilloscope screenshot of the raw pulse signal (yellow, CH1), and reference signal from the pressure gauge (cyan, CH2), showing the cardiac-simulated pressure generated by the pump and detected by the probe. Horizontal axis: time, 500ms per division.
