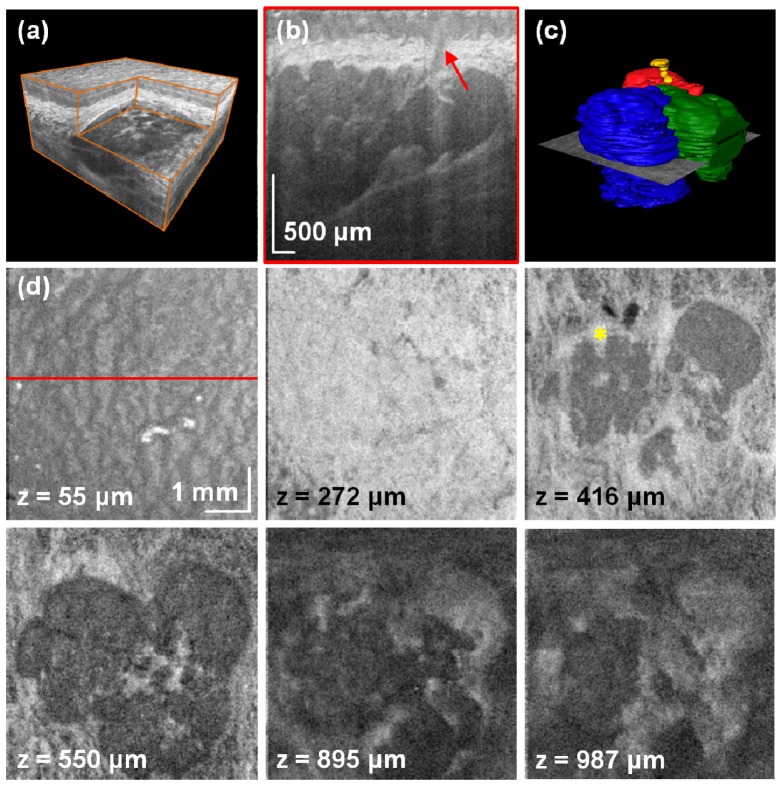
Fig. 4.
High-definition imaging of the LMSGs. (a) Rendering of the volumetric data set with the corner cut. (b) Cross-sectional image of the mucosal tissue. The arrow indicates the excretory salivary duct. (c) Segmentation of the glandular units and the salivary duct (Media 3 (3.7MB, MPG) ). (d) C-scans at different depths showing anatomical features of the mucosa and details of the glandular tissue. Asterisk indicates blood vessels in oral mucosa. A flythrough demonstrating structures at different depths (Media 4 (3.8MB, MPG) ).

