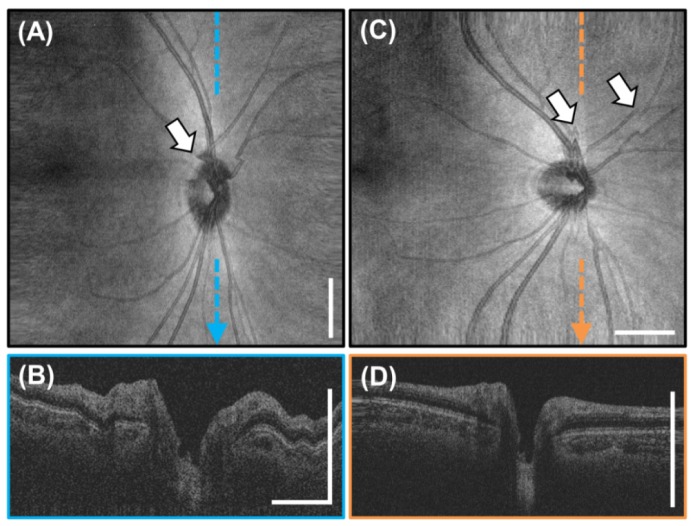
Fig. 4.
6 x 6 mm2, 1400 x 350 A-scan sinusoidally raster scanned volumes of the optic nerve head acquired in 1.4 seconds each. (A) OCT fundus of the horizontal sinusoidal raster scan. (B) Indicated cross section. (C) OCT fundus of the vertical sinusoidal raster scan. (D) Indicated cross section. Arrows indicate motion artifacts. Scale bars are not displayed in the sinusoidally scanned directions due to nonlinear spacing. Scale bars are 1 mm.

