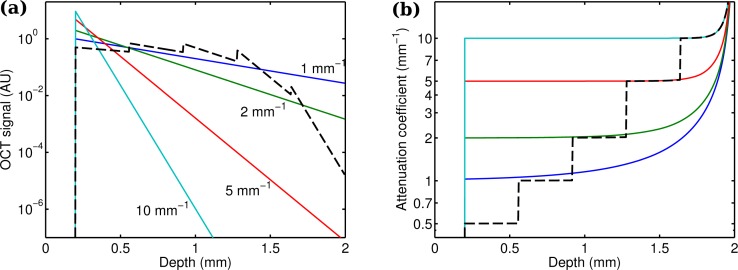
Fig. 2.
(a) Simulated OCT signals and (b) estimated attenuation coefficients (Eq. (17)) for uniform and layered phantoms with various attenuation coefficients. Solid lines: Simulated thick phantoms, with attenuation coefficients of 1 mm−1, 2 mm−1, 5 mm−1 and 10 mm−1. Different attenuation coefficients result in different slopes in the OCT signal. The proposed method is capable of depth-resolved estimation of the attenuation coefficient from the OCT signal with high accuracy. Dashed line: Simulated 5-layer phantom with an individual layer thickness of 360 μm and attenuation coefficients of 0.5 mm−1, 1 mm−1, 2 mm−1, 5 mm−1 and 10 mm−1. The proposed method can accurately estimated the attenuation coefficient of the various layers.

