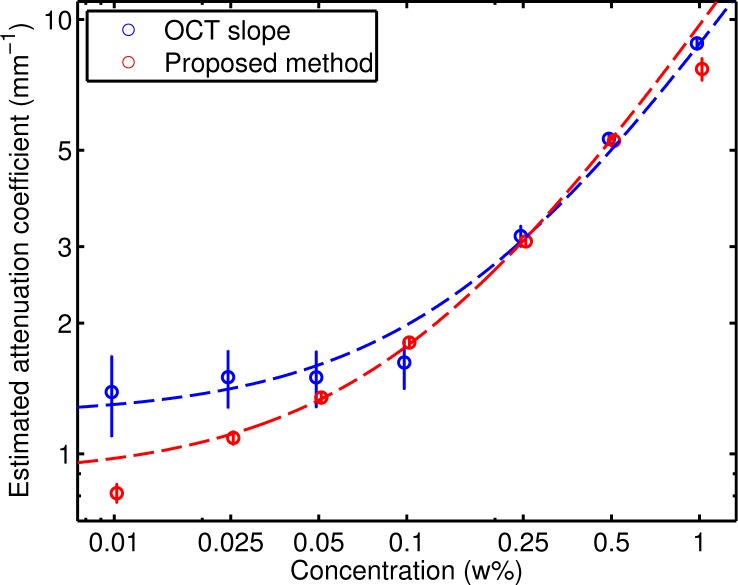
Fig. 6.
Attenuation coefficients determined by fitting an exponential curve to the OCT data (blue) and by the proposed method (red), over a depth of 0.25 mm. The circles denote the measurements and the vertical lines indicate the 95% confidence interval. The dashed lines are robust fits (with bisquare weights) of the model log(yi) = log(a + bxi) +εi.

