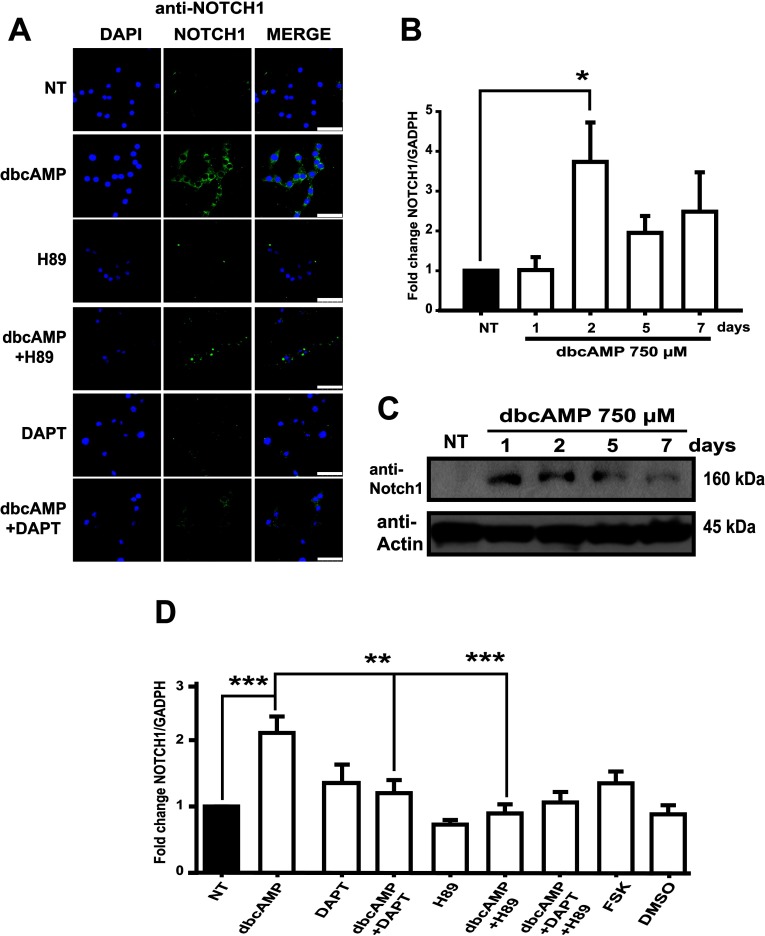
Figure 7. Induction (activation) of PKA-Notch pathway up-regulates Notch1 gene expression during astrocytic differentiation of C6 cells.
(A) Immunostaining and imaging obtained with a Leica confocal microscope and using anti-Notch1 (green) and the nuclei were counterstained with DAPI (blue) in C6 cells treated as indicated (the same conditions used in previous Figures, harvesting 48 h after treatment). Scale bar=50 μm. (B) Total RNA was obtained from C6 cells treated as indicated and processed for qRT-PCR to amplify a 170 bp fragment from Notch1 mRNA (nucleotides 7094–7263). (C) Approximately 30 μg of total protein extract from dbcAMP-treated cells were processed for Western blot to identify Notch1 using an antibody designed for detecting only the extracellular portion. (D) A representative Western blot is shown. qRT-PCR for Notch1 mRNA in C6 cells treated as indicated (the same conditions used in previous Figures, harvesting 48 h after treatment). For all qRT-PCR, data are plotted as means±S.E.M. from a minimum of three independent experiments and relative to values recorded in non-treated (NT) control and using GAPDH levels as reference. Statistical analysis was performed using a non-parametric one-way ANOVA (Kurskal–Wallis test) and Dunn's post-hoc test (**P<0.01; ***P<0.001).

