
Figure 4. Effect of therapeutics on MCT.
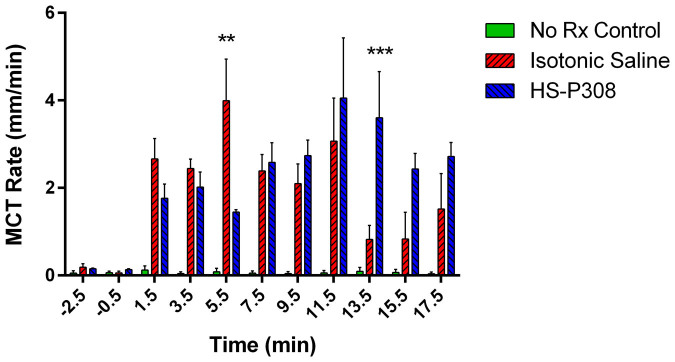
The MCT rate was calculated by manually tracking the movement of up to 50 particles across 10 frames at each time point in each mouse. MCT rates are presented as mean and standard error of the mean  . Statistical significance was set at p = 0.05 and power = 0.80 and MCT rates were analysed by two way RM-ANOVA with Bonferroni multiple comparisons. The difference in MCT rate between the Isotonic and HS-P308 group at the 5.5 and 13.5 min time points was statistically significant (**p < 0.01 and *** p < 0.001).