
Figure 1.
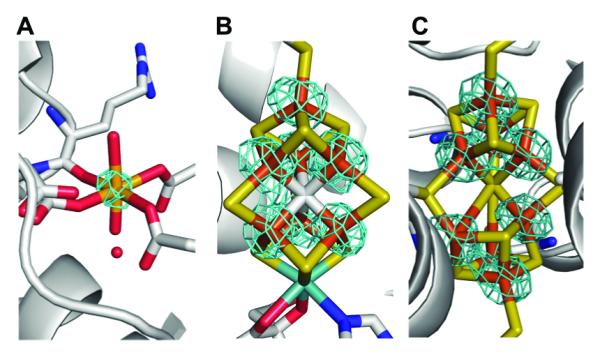
The double difference (Δanom7130eV – Δanom7080eV) anomalous density maps (highlighted in cyan) at the MMB–site (A), the FeMo–cofactor (B) and the P–cluster (C). The Fe atoms are shown in orange, Mo in cyan, S in yellow, C in gray, N in blue and O in red. These maps are contoured at the level of 10 sigma.