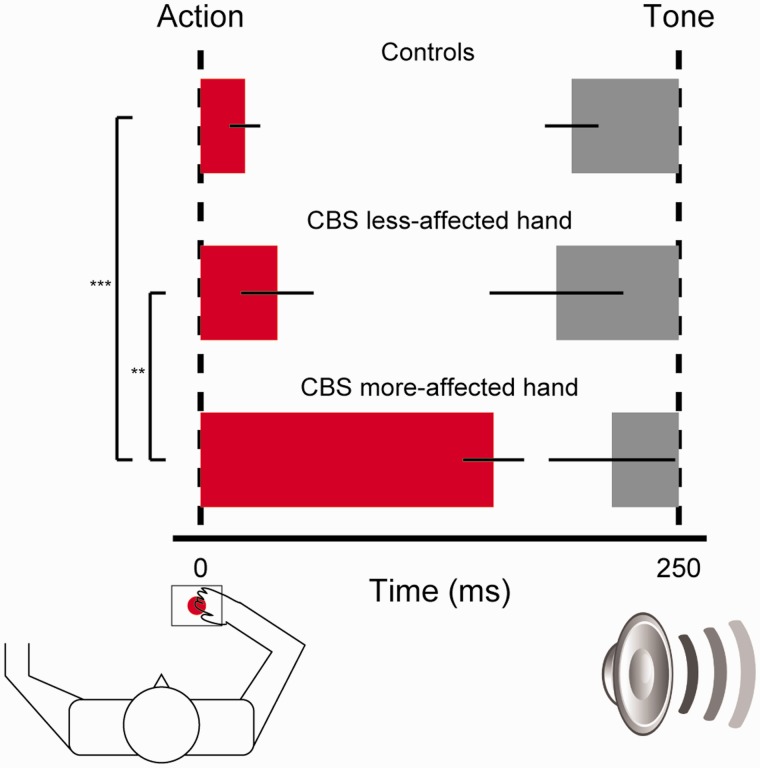
Figure 2.
Action and tone binding in controls and patients with CBS. The bar chart illustrates the differences in the perception of time of action and tone between the two hands (averaged together) in controls and (separated) in patients with CBS. Mean action (red bar) and tone (grey) binding values are displayed proportionally to their perceptual shift (error bars indicate mean standard error). Dashed lines indicate the veridical time of action and tone events. Significance level in pair-wise comparisons is indicated by ***P < 0.001 and **P < 0.01.

