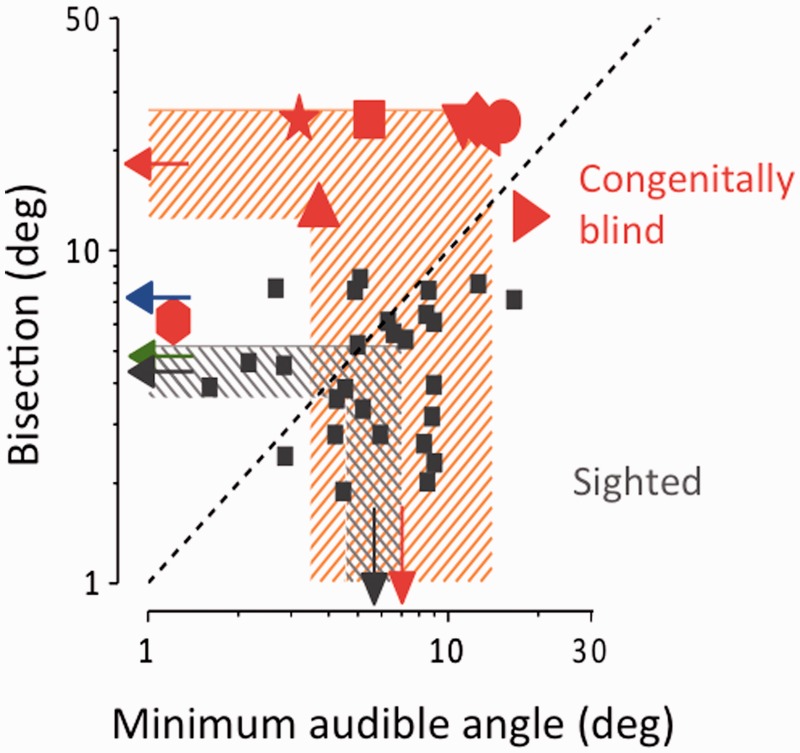
Figure 2.
Individual data, plotting bisection thresholds against minimal audible angle, calculated from the width of individual psychometric functions (Supplementary Figs 1 and 2). When no fit was plausible, they were assigned a value of 25° (50% the total spacing of the display). Arrows at the margin show the geometric means of each group and the shaded areas the 95% confidence intervals. The blue and green arrows show the average thresholds for 7- and 10-year-old children, respectively, taken from a previous study (Gori et al., 2012a). The dashed diagonal line is the equality line: whereas the thresholds of the sighted subjects are scattered around this line, all except one non-sighted subject is above it. Indeed, the only non-sighted subject with bisection thresholds falling within the control range (Subject 8) had a threshold for minimal audible angle threshold 6-fold lower than the mean of the controls, so her data point falls well above the bisection line.

