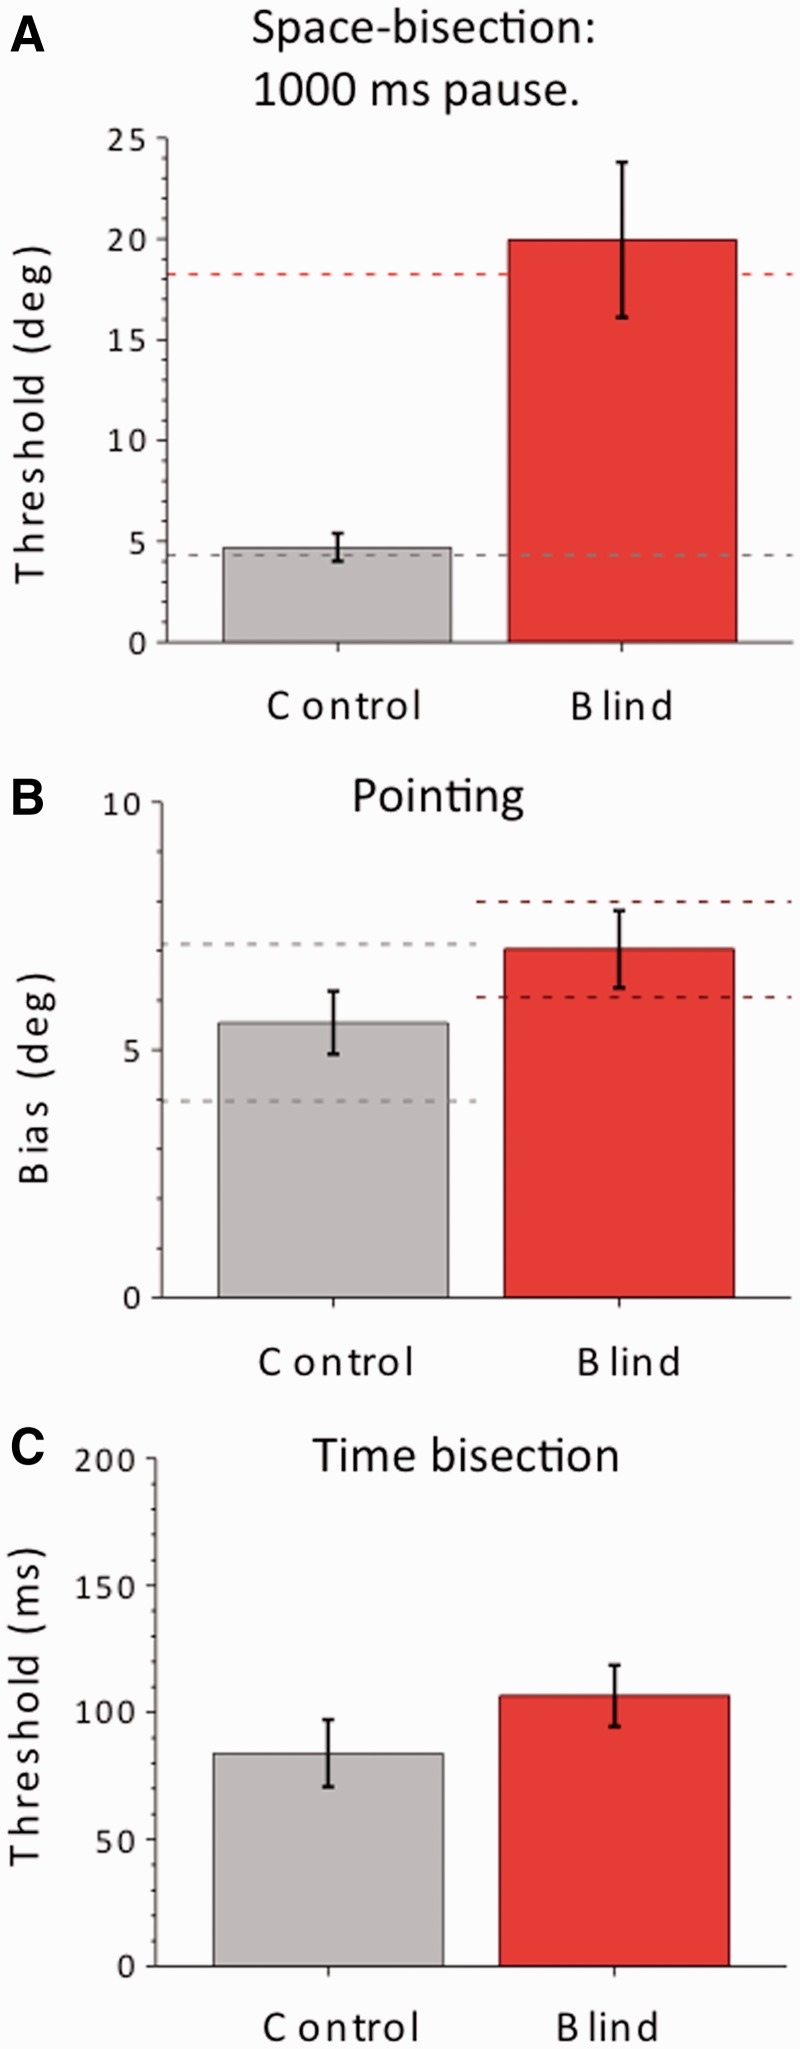
Figure 3.
Average thresholds in three additional tasks, for a subset of non-sighted patients and the same number of age- and gender-matched group of blindfolded sighted controls. The bars indicate ±1 standard error of the mean. (A) Space bisection with 1000 ms separation between the sounds. The impairment of the patient group remains highly significant (Bootstrap sign-test: P < 10−5). The test was performed in six non-sighted and six sighted individuals. Dashed red and grey lines refer to the average performance of subjects for the bisection task with the 500 ms separation. (B) Average error in laser-pointing to a single sound. The error measure (which comprises both accuracy, bars; and precision, dashed lines) is the average absolute distance between real and pointed values. The performance of the patient group is not significantly different from the sighted group (t-test, P = 0.07). The test was performed in seven non-sighted and seven sighted individuals. (C) Thresholds in the temporal bisection task, determined separately for each subject, then averaged. The performance of the patient group is not significantly different from the sighted group (t-test, P = 0.14). The test was performed in eight non-sighted and eight sighted individuals.

