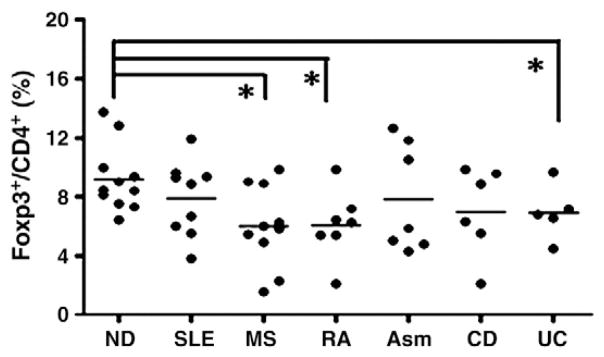
Figure 1.

The frequency of Foxp3+ Treg cells in the CD4+ T cell population of patients and normal donors. CD4+ T cells were purified from the peripheral blood of patients with SLE, RA, MS, CD, UC, asthma and normal donors (ND) as described. The frequencies of Foxp3+ Treg cells in the peripheral blood CD4+ population of patients and normal donors were determined with intracellular Foxp3 staining. The percentage of Foxp3+ Treg cells in CD4+ T cell population from each patient was shown. Each dot represents one subject and the bar represents the average percentage of Foxp3+ Treg cells in each group (*p<0.05, Mann Whitney test for two group comparison).
