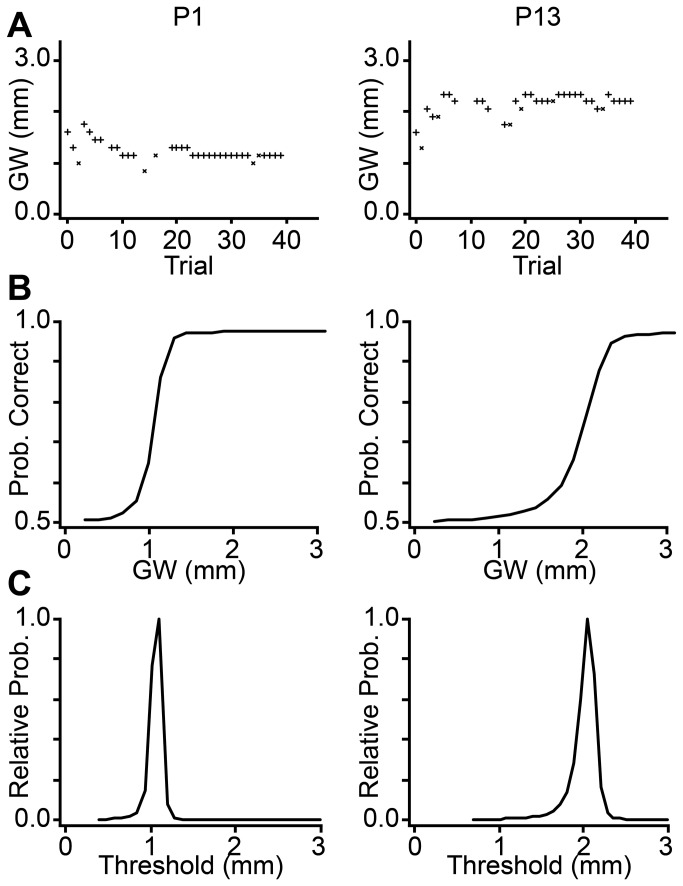
Figure 1. Bayesian adaptive procedure for threshold groove width estimation.
Sensory data for two participants (P) are shown in columns: Left panels: P1, female, age 15.9 years, fingertip surface area = 362.8 mm2; Right panels: P13, male, age 16.8 years, fingertip surface area = 519.9 mm2. (A) Each participant's performance plot (+ = correct response, x = incorrect response) on a single testing block. Occasional trials in which the force sensor detected finger movement were automatically discarded (symbols not plotted) so as not to influence the Bayesian adaptive procedure. (B) Corresponding best-estimate psychometric functions. (C) PDFs over the threshold groove width. Note that, compared to P1, P13 has an upward-shifted performance plot, a rightward shifted psychometric function, and a rightward-shifted threshold PDF, indicative of poorer performance; given the participants' similar ages, this performance difference is likely due to the large difference between the participants' fingertip sizes. GW: groove width; Prob: probability.

