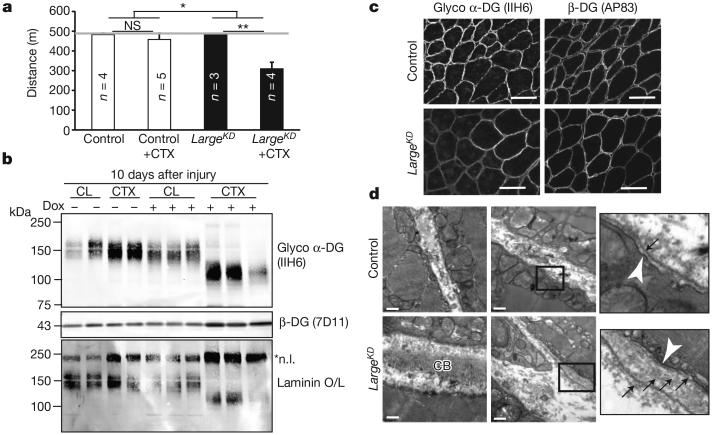
Figure 2. Regenerating LargeKD muscle has α-DG of reduced molecular mass and basement membrane defects.
a, Quantification of muscle performance in downhill treadmill assay. Mice were injected bilaterally in the tibialis anterior and gastrocnemius muscles, and were given a 21-day recovery period. Grey line indicates predetermined assay end point (performance averages, interaction between genotype and CTX injury P=0.015, post-hoc comparisons *P<0.05, ** P<0.0001, error bars indicate s.e.m., n=biological replicate number for trial depicted, 3 experimental replicates). b, Western blot analysis and laminin overlay assay prepared from regenerating muscle, each lane representing an individual animal. CL, contralateral (un-injured) muscle; *n.l., native laminin. c, IIH6 and β-DG immunoreactivity of muscle sections. d, Muscle ultrastructure as assessed by transmission electron microscopy. White arrowhead, sarcolemma; black arrows, basement membrane; CB, collagen bundles. Samples in b–d were taken 10 days after CTX injury; scale bars, 50 μm (c) and 0.5 μm (d).

