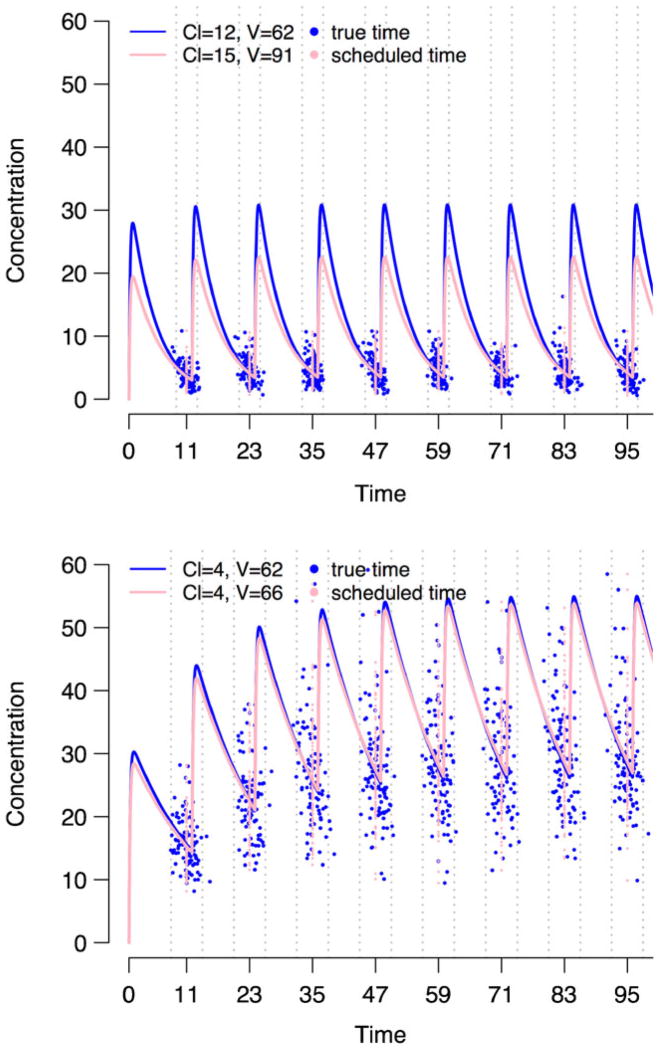
Fig. 1.
Population mean profiles estimated using the true sampling times and the scheduled times from representative simulated data sets with 100 subjects. For the simulation, two scenarios of true PK parameters were used for illustrative purpose: CL=12.6 l h−1 for fast clearance and CL=4.2 l h−1 for slow clearance (both with V =60 l being held fixed). Also moderate (with fast clearance) or large (with slow clearance) time ME was assumed. The simulated data sets with the true sampling times (blue dots) and the same data with the true sampling times being replaced by the scheduled times (pink dots) were fit, and the estimated population mean PK profiles in the same color are presented along with their estimated numerical values shown within the figure. Upper panel: fast clearance CL=12.6 l h−1 with moderate time ME σu =1 h; bottom panel: slow clearance CL =4.2 l h−1 with large time ME σu =1.5 h, where σu is the standard deviation of time ME. The dotted gray lines represent the scheduled sampling times ±2σu, where most true sampling times would lie within these lines

