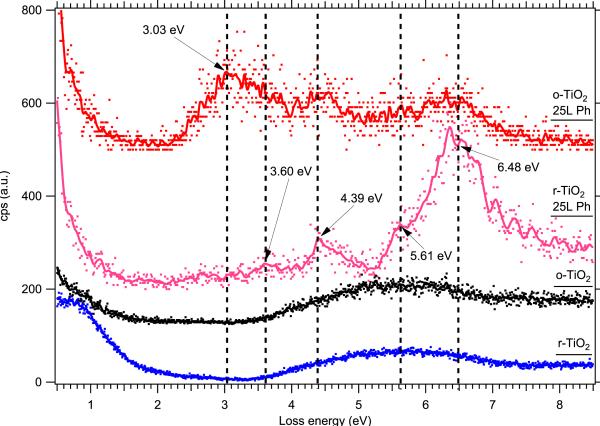
FIG. 2.
EELS data showing electronic excitations from clean and phenol-covered TiO2(110) single crystals. From bottom to top, we show clean lightly reduced TiO2(110), fully oxidized TiO2(110), 25 L phenol on reduced TiO2(110), and 25 L phenol on oxidized TiO2(110). Phenol dosing, as well as each measurement, was done with the sample held at 90 K. The dots show the raw spectra (normalized to the elastic peak from r-TiO2), and the solid curves show the data smoothed by a binomial algorithm. Vertical dashed lines are guides to the eye.

