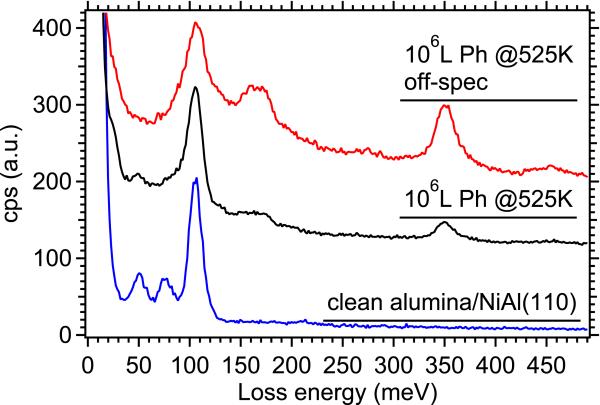
FIG. 6.
Vibrational EELS spectra of clean alumina/NiAl(110) (blue) and adsorption of 106 L phenol on alumina/NiAl(110) at 525 K, showing both on-specular (black) and off-specular (red) geometry. In this figure, spectra have been normalized to the height of the peak at 103 meV to more clearly show the relative intensity of vibrational peaks. All measurements were taken at room temperature.

