Abstract
Super-resolution optical microscopy is opening a new window to unveil the unseen details on the nanoscopic scale. Current far-field super-resolution techniques rely on fluorescence as the read-out1–5. Here, we demonstrate a scheme for breaking the diffraction limit in far-field imaging of non-fluorescent species by using spatially controlled saturation of electronic absorption. Our method is based on a pump-probe process where a modulated pump field perturbs the charge-carrier density in a sample, thus modulating the transmission of a probe field. A doughnut shape laser beam is then added to transiently saturate the electronic transition in the periphery of the focal volume, thus the induced modulation in the sequential probe pulse only occurs at the focal center. By raster scanning the three collinearly aligned beams, high-speed sub-diffraction-limited imaging of graphite nano-platelets was performed. This technique potentially enables super-resolution imaging of nano-materials and non-fluorescent chromophores, which may remain out of reach for fluorescence-based methods.
The recently developed pump-probe microscopy technique has allowed label-free imaging of melanin 6, 7, chromoproteins and chromogenic reporters 8, epitaxial graphene9 and carbon nanotubes 10, by perturbing the sample of interest with a modulated pump field and detecting the subsequent material response with an interrogating probe field. Contrast mechanisms in pump-probe microscopy are based on transient absorption processes, including simulated emission 8, 10, ground state bleaching 11, and excited-state absorption 6. The existence of a nonlinear optical response in the sample offers the opportunity to break the diffraction limit 2, 12. The method we describe here, which we name “saturated transient absorption”, is related to a group of super-resolution techniques generalized under the concept of reversible saturable optical fluorescence transitions (RESOLFT), in which resolution enhancement is achieved by spatially tailoring the fluorescence emission volume to a sub-diffraction-limited size 1–3, 13. Here, we show the first experimental implementation of this concept for super-resolution imaging of non-fluorescent species using a pump-probe technique. In particular, we demonstrate a diffraction-limit-breaking scheme by ground state depletion of the charge carrier in graphene-like structures.
Considering a two-state system shown in the left panel of Fig. 1 (a), probe photons at ωpr are absorbed to excite the system from L0 to L1, leading to a transmission decrease. When a pump field at ωp is introduced, the pump excitation depletes the population of L0, thus decreasing the absorption of the probe light accordingly (Fig. 1 (a) middle panel). When the intensity of the pump field is high enough, it saturates the electronic transition, either by depleting the population at L0 or by filling the L1 energy states. As a result, the transient absorption of probe photons is suppressed (Fig. 1 (a) right panel). Based on this concept, saturated transient absorption microscopy is designed to decrease the probe area to below the diffraction limit in a pump-probe microscope by collinearly adding a non-modulated saturation beam (ωsat), which has the same wavelength as the pump beam but with much higher intensity (Fig. 1 (b)). At the doughnut shaped region of the focus where the intensity of the saturation beam is high, the transmission of the probe beam remains unchanged due to the saturation of the electronic transition. Under such conditions, the pump to probe modulation transfer only occurs at the very center of the focus where the intensity of the saturation beam is close to zero (Fig. 1 (c)). Sub-diffraction-limited images can be obtained by raster-scanning the three collinearly aligned beams simultaneously across the sample.
Figure 1. Principle of the saturated transient absorption microscopy.
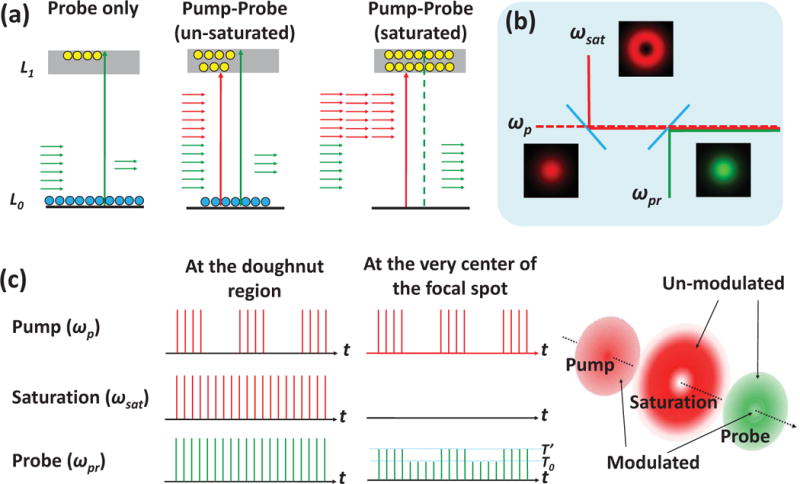
(a) Illustration of the saturation effect in a two level electronic transition. Pump and probe photons are indicated by red and green arrows, respectively. (b) Brief layout of the setup. The dash line indicates that the pump beam is modulated. (c) The pulse train of pump, saturation and probe beam at the focused doughnut-shape region (left panel) and at the very center of the focal spot (middle panel). The modulation transfer from pump to probe only occurs at the center where the saturation field intensity close to zero (right panel).
We used graphene-like structures, whose saturable absorption properties have been studied 14–16, to demonstrate the concept of saturated transient absorption microscopy. Epitaxial graphene has been investigated by pump-probe microscopy, where the pump-induced charge carriers fill the states near the edge of conduction and valence bands, thus reducing the probe absorption 9. As the power of the pump increases, saturable absorption of the pump or absorption bleaching of the probe was reported as a result of the Pauli blocking process 17. The relaxation time of the photo-excited charge carriers determines the optimal condition for the pump-probe contrast in graphene-like systems. Briefly, the excited carriers first experience a fast carrier-carrier recombination process on a time scale of 20–30 fs18, and then interact with optical phonons in a relative slow process on a time scale from 100 fs to a few picoseconds 19. As a result, a reasonable contrast from a pump-probe measurement of graphene can be achieved by using pump and probe pulses which have a duration and temporal delay at the sub-picosecond scale. To actively suppress the pump-probe signal, an un-modulated, intense saturation pulse is temporally inserted between the pump and probe pulses.
The saturated transient absorption microscope is illustrated in Fig. 2 (details in method section). Briefly, a 1064 nm beam with 260 fs pulse duration was split into pump and saturation beams. An 830 nm beam with 140 fs pulse duration was collinearly aligned with the pump and saturation beams. A spatial light modulator was employed to engineer the focus of the saturation beam by applying selected phase patterns. All three beams were initially set as linearly polarized.
Figure 2. Diagram of the saturated transient absorption microscope.
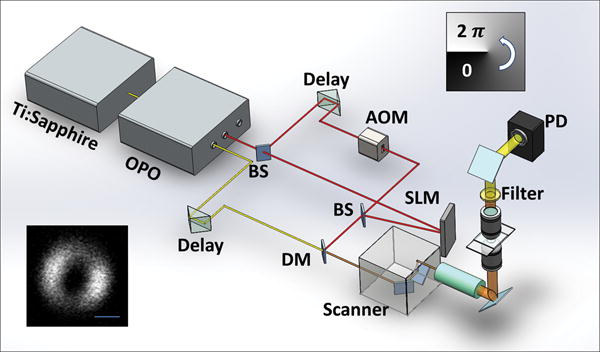
OPO: optical parametric oscillator; AOM: acousto-optic modulator; BS: beam splitter; SLM: spatial light modulator; PD: photodiode; DM: dichroic mirror. Upper-right inset: the helix phase pattern sent to SLM to generate doughnut shape focus of the saturation beam. Lower-left inset: the measured point spread function of the saturation beam using second harmonic imaging of 20 nm ZnO nano-crystals. Scale bar: 500nm.
Using this setup, we have identified the parameters for effective suppression of the pump-probe signal. We first performed time-resolved pump-probe spectroscopy to characterize the relaxation time of the photo-excited charge carriers, under the condition that powers of pump and probe beams on the sample were both 0.16 MW/cm2. The transient absorption spectrum of graphene was fitted by a two-component exponential decay model with time constants of 0.4 and 2.0 ps and relative amplitudes of 1.6 and 1.0, respectively (black dots in Fig. 3 (a)). Since the fast carrier-carrier recombination process at the time scale of sub-100 fs cannot be resolved by our system, the fast decay constant represents the instrument response time in these measurements. The slow decay process is attributed to carrier-phonon interaction. We then introduced a saturation pulse with a Gaussian mode and power density of 0.8 MW/cm2. The delay between the pump and saturation pulses was set to ~0.4 ps to avoid interference (Fig. 3 (a)). The pump-probe signal remained unaffected in the first 100 fs, and was quenched significantly after 0.4 ps when the saturation pulse was introduced. The pump-probe signal from graphene as a function of the power density of the saturation beam is plotted in Fig. 3 (b). The data were fitted by eq. S4 (Supplementary Information) and the value of I0, the power density for saturated absorption, was obtained as 0.28 MW/cm2. The same experiments were performed on graphite nano-platelets and similar characteristics for graphene were found (Fig. 3 (c–d)). The time constant of the carrier-phonon interaction on graphite nano-platelets was found to be ~0.6 ps, and I0 was 0.43 MW/cm2. The recovery of pump-probe signal was also tested using the graphene sample. As shown in right panel of Fig. 3 (e), the signal recovered to nearly 100% when the saturation beam was switched off. No signal degradation was observed during the imaging period of 60 s, under the condition that the power density of the saturation beam was 1.2 MW/cm2 and the dwell time was ca. 2 s for an image of 512 by 512 pixels. The photodamage started to appear at around 2.4 MW/cm2 for the graphite nano-platelets sample if we repeated imaging the same area for 60 s. Therefore, we applied a saturation beam power lower than the damage threshold for the resolution enhancement experiments.
Figure 3. Suppression of pump-probe signal by saturation of electronic transition in graphene and graphite nano-platelets.
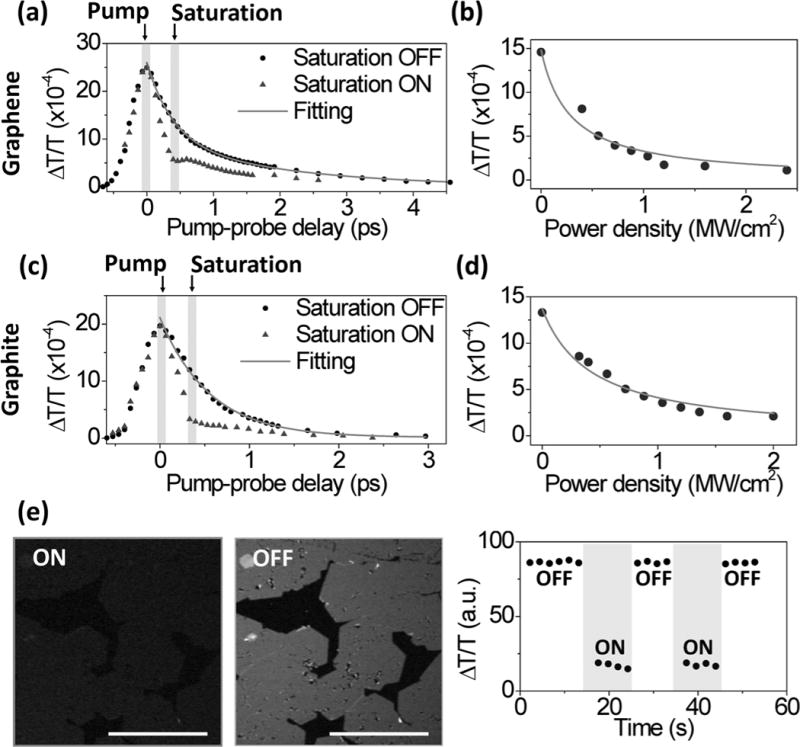
(a) Time-resolved transient absorption spectroscopy on graphene sample with (triangles) and without (circles) saturation beam. (b) The pump-probe signal as function of the peak power density of the saturation beam on graphene. The fit generates a saturation constant at 0.28 MW/cm2. (c-d) The same measurements as (a) and (b) but on graphite nano-platelets. (e) Transient absorption image of graphene with the saturation beam switched on (left panel) and off (middle panel). The average intensity of graphene was plotted as function of time (right panel). Scale bar: 20 μm.
With these parameters, we conducted label-free far field imaging of graphite nano-platelets by applying the doughnut shaped saturation beam. Conventional pump-probe imaging and saturated transient absorption imaging were performed in the same region (Fig. 4 (a–b)) visualized by anatomic force microscopy (AFM) (Fig. 4 (c)). The power for the saturation beam was set at 2.0 MW/cm2. The intensity shown in the pump-probe images is proportional to the difference transmission of the probe beam, ΔTpr, between pump field on and off states. The nano-platelets indicated in the AFM images (white arrows in Fig. 4 (c)) could not be resolved in the conventional pump-probe image (Fig. 4 (a)), but were successfully resolved by saturated transient absorption microscopy (Fig. 4 (b)). To quantify the resolution enhancement, we imaged an area where isolated nano-platelets can be found (Fig. 4 (d–e)). The averaged full-width at half-maximum (FWHM) measured in the selected platelets is 249 ± 31 nm (Supplementary Information, Fig. S1). We selected one of the smallest features in the image to characterize the resolution. The line profiles across the selected nano-platelet (white arrows) by conventional pump-probe and saturated transient absorption are shown in Fig. 4 (f). By Gaussian fitting of the line profiles (Fig. 4 (f)), FWHM of the same isolated object in the conventional pump-probe and saturated transient absorption images were found to be 385 nm and 225 nm, respectively. The line profile is theoretically a convolution of the effective point spread function (PSF) of the system with the object (Supplementary Information). Considering that the average size of the nano-platelets is ~100 nm, deconvolution of the line profile and object function using the Gaussian approximation resulted in FWHMs of ~370 nm and 200 nm for the effective PSF of conventional pump-probe and saturated transient absorption microscopy, respectively. Given the nonlinear nature of the pump-probe process and the aperture free detection scheme, the effective PSF of our pump-probe microscope under diffraction-limited conditions is calculated to be 300 nm (Supplementary Information). These results collectively demonstrate that sub-diffraction-limit imaging is achievable by the saturated transient absorption microscopy technique.
Figure 4. Sub-diffraction-limit imaging of graphite nano-platelets.
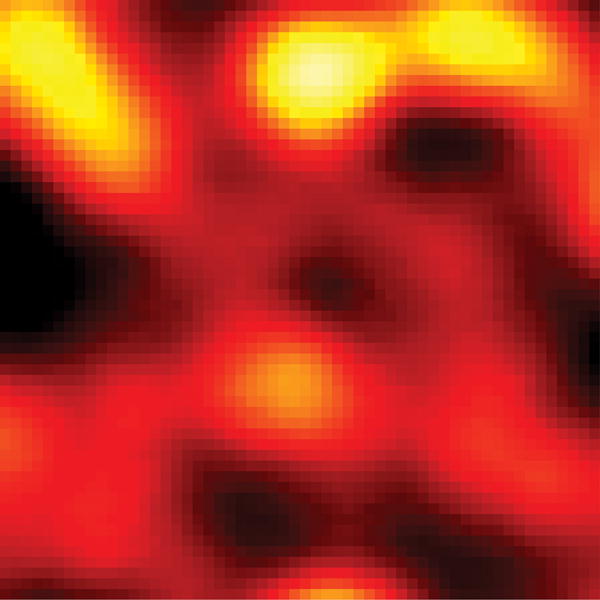
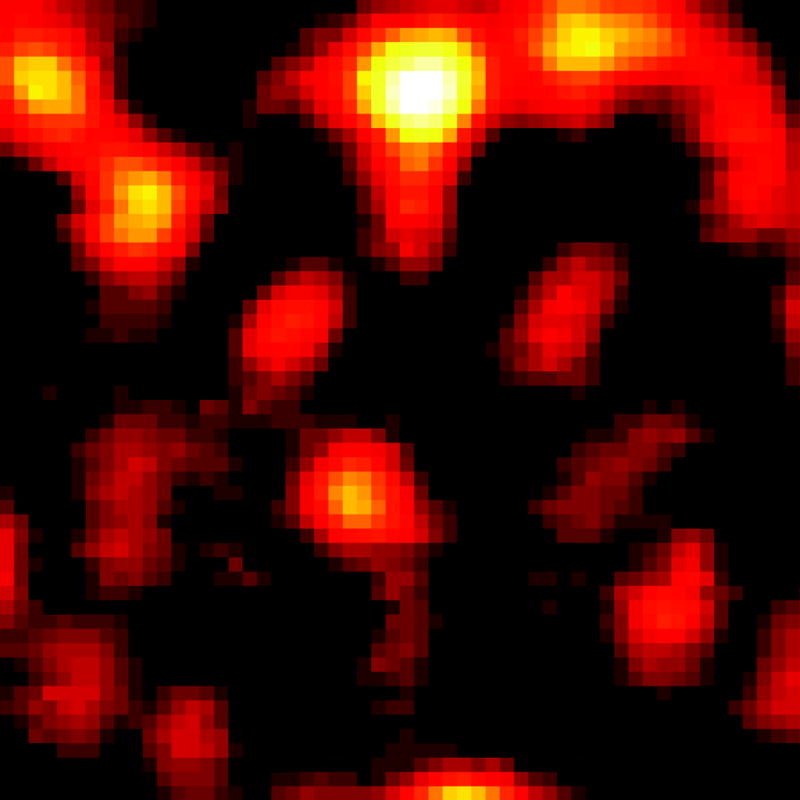
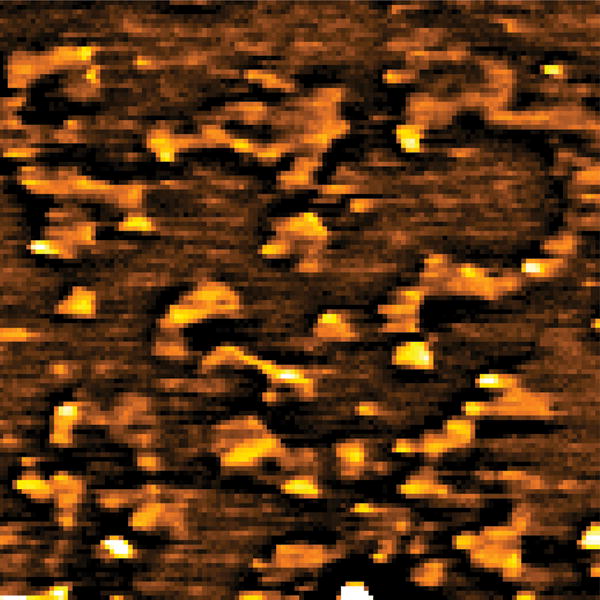
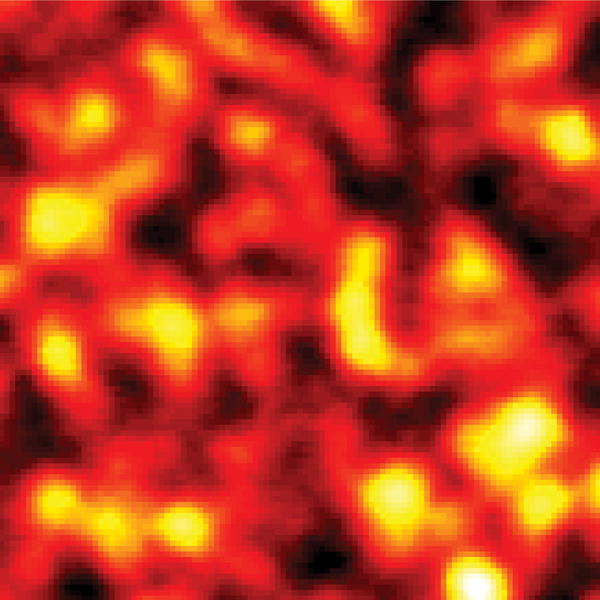
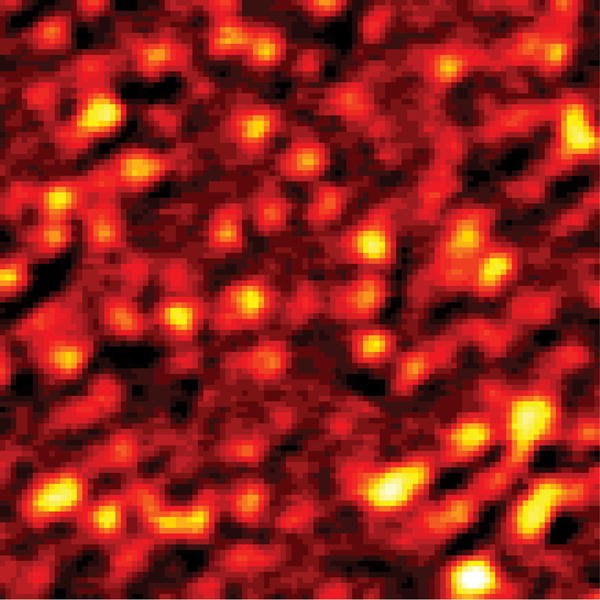
(a, d) Images by conventional pump-probe microscopy. (b, e) Images of the same areas by saturated transient absorption microscopy. (c) AFM images of the graphite nano-platelets. (f) Intensity profiles along the lines indicated by the arrows in (d) and (e). Solid curves represent Gaussian fitting. For comparison of resolution, the peak intensities were normalized to the same value. TA: transient absorption. Scale bar: 1 μm.
In summary, we demonstrated far-field sub-diffraction-limited imaging of non-fluorescent samples through spatially controlled saturation of the transient absorption signal. The resolution can be further improved through optimization of the imaging conditions, such as applying a shorter excitation wavelength and increasing the photodamage threshold upon faster scanning. We note that saturated transient absorption microscopy is applicable to other nanomaterials with saturable absorption, such as single-wall carbon nanotubes 20–22 as well as iron oxide and zinc oxide nanoparticles 23, 24, which are considered as biocompatible imaging agents 25, 26. Compared to previously reported pump-probe nanoscopy, which is based on scanning tunneling microscope or near-field scanning optical microscope 27, our method offers a much faster imaging speed in a contact-free manner. Moreover, the intrinsic optical sectioning capability of saturated transient absorption microscopy enables 3-dimensional imaging with a lateral resolution below the diffraction limit. Resolution enhancement in the axial direction is also possible by applying a z-doughnut beam 28. These advantages open new opportunities for studying nanostructures in biological environments or inside functional materials.
Methods
Experiment setup
A Ti:Sapphire laser at 830 nm (80 MHz, ~140 fs pulse width, Chameleon, Coherent, CA) pumped an optical parametric oscillator (OPO, APE, Coherent, CA), providing a 1064 nm output with ~260 fs pulse width. The 1064 nm beam was split into two arms as pump and saturation beams, respectively. The pump beam was modulated by an acousto-optic modulator (AOM, Gooch & Housego, CA) at ~7 MHz. The saturation beam was directed to a phase-only spatial light modulator (PLUTO, Holoeye, Germany) and a doughnut shape was produced by inputting a helical phase ramp from 0 to 2π (Fig. 2 inset). Relay optics were applied to project the doughnut shape beam to the back aperture of the objective. The 830 nm beam was used as the probe and was collinearly combined with the pump and saturation beams. The three beams were sent to a laser scanning microscope (IX71, Olympus, CA), and focused into a sample by a water immersion objective (NA=1.2, Olympus, CA). The transmitted probe beam was collected by another water immersion objective, filtered by two bandpass filters (825/150 Chroma, VT), and detected by a photodiode (S3994-01, Hamamatsu, Japan) followed by a resonant amplifier 29. A lock-in amplifier (HF2LI, Zurich Instrument, Zurich) was used to extract the probe signal at the modulation frequency. The pixel dwell time was ~4 μs. For imaging, the delay between the pump and saturation pulses was 0.4 ps. The probe pulse was temporally overlapped with the saturation pulse.
Synthesis and AFM imaging of graphite nano-platelets
A 1:6 diluted S-1805 photoresist film was spun-coated on the quartz wafer at 10,000 rpm, and the thickness of the coated film was less than 100 nm. The substrates were then baked for 5 minutes at 120 ºC. The coated quartz wafer was covered by another piece of quartz wafer, and then mounted on a sample stage in a vacuum chamber. Before growing graphite nano-platelets, the chamber was pumped and purged by high-purity N2 gas, and maintained at a pressure below 0.1 Torr. A continuous wave (CW) Nd:YAG laser with a wavelength of 532 nm was focused on the S-1805 film through the transparent quartz substrate using a lens of 150 mm focal length. With this optical setup, the graphite nano-platelets sample was produced with a laser power of 2.8 W, irradiated for 3–5 minutes. The size and the coverage of the graphene platelets are determined by the growth parameters. Raman spectroscopy was performed to confirm the composition of the sample (Fig. S2). AFM (Veeco Dimension 3100) images were taken with the tapping mode under ambient conditions.
Synthesis of graphene
Graphene was grown by thermal chemical vapor deposition on a Cu foil, at a temperature of 1000 °C and under 1 atm pressure with methane as the precursor gas30. The PMMA was then removed by repeatedly rinsing the film in acetone. Raman spectroscopy was performed to confirm the composition of the sample (Fig. S3).
Supplementary Material
Acknowledgments
This work was supported by National Institutes of Health grant R21EB015901 to J-X.C, National Science Foundation grant CHE-0847097 to E.O.P., and Defense Advanced Research Project Agency (Grant No N66001-08-1-2037, Program Managers Dr. Thomas Kenny and Dr. Tayo Akinwande) to X.X. We thank Dr. Yong Chen and Jack Chung for providing the graphene sample, and Delong Zhang for technical support.
Footnotes
Author contribution: P.W., M.N.S. and J-X.C. designed the experiment. P.W. and M.N.S performed the experiments. P.W. carried out the data analysis. JM synthesized the graphite nano-platelets. EOP provided the spatial light modulator. J-X.C., C.Y., E.O.P. and X.X. provided overall guidance to the project. All authors discussed the results and contributed to the manuscript.
References
- 1.Hell SW, Wichmann J. Breaking the diffraction resolution limit by stimulated emission: stimulated-emission-depletion fluorescence microscopy. Opt Lett. 1994;19:780–782. doi: 10.1364/ol.19.000780. [DOI] [PubMed] [Google Scholar]
- 2.Bretschneider S, Eggeling C, Hell SW. Breaking the diffraction barrier in fluorescence microscopy by optical shelving. Phys Rev Lett. 2007;98:218103. doi: 10.1103/PhysRevLett.98.218103. [DOI] [PubMed] [Google Scholar]
- 3.Gustafsson MGL. Nonlinear structured-illumination microscopy: Wide-field fluorescence imaging with theoretically unlimited resolution. Proc Natl Acad Sci USA. 2005;102:13081–13086. doi: 10.1073/pnas.0406877102. [DOI] [PMC free article] [PubMed] [Google Scholar]
- 4.Rust MJ, Bates M, Zhuang X. Sub-diffraction-limit imaging by stochastic optical reconstruction microscopy (STORM) Nat Methods. 2006;3:793–796. doi: 10.1038/nmeth929. [DOI] [PMC free article] [PubMed] [Google Scholar]
- 5.Betzig E, et al. Imaging intracellular fluorescent proteins at nanometer resolution. Science. 2006;313:1642–1645. doi: 10.1126/science.1127344. [DOI] [PubMed] [Google Scholar]
- 6.Fu D, Ye T, Matthews TE, Yurtsever G, Warren WS. Two-color, two-photon, and excited-state absorption microscopy. J Biomed Opt. 2007;12:054004–054008. doi: 10.1117/1.2780173. [DOI] [PubMed] [Google Scholar]
- 7.Matthews TE, Piletic IR, Selim MA, Simpson MJ, Warren WS. Pump-probe imaging differentiates melanoma from melanocytic nevi. Sci Transl Med. 2011;3:71ra15. doi: 10.1126/scitranslmed.3001604. [DOI] [PMC free article] [PubMed] [Google Scholar]
- 8.Min W, et al. Imaging chromophores with undetectable fluorescence by stimulated emission microscopy. Nature. 2009;461:1105–1109. doi: 10.1038/nature08438. [DOI] [PubMed] [Google Scholar]
- 9.Huang L, et al. Ultrafast transient absorption microscopy studies of carrier dynamics in epitaxial graphene. Nano Lett. 2010;10:1308–1313. doi: 10.1021/nl904106t. [DOI] [PubMed] [Google Scholar]
- 10.Jung Y, et al. Fast detection of the metallic state of individual single-walled carbon nanotubes using a transient-absorption optical microscope. Phys Rev Lett. 2010;105:217401. doi: 10.1103/PhysRevLett.105.217401. [DOI] [PubMed] [Google Scholar]
- 11.Chong S, Min W, Xie XS. Ground-state depletion microscopy: detection sensitivity of single-molecule optical absorption at room temperature. J Phys Chem Lett. 2010;1:3316–3322. [Google Scholar]
- 12.Bouwhuis G, Spruit JHM. Optical storage read-out of nonlinear disks. Appl opt. 1990;29:3766–3768. doi: 10.1364/AO.29.003766. [DOI] [PubMed] [Google Scholar]
- 13.Hell SW. Toward fluorescence nanoscopy. Nat Biotechnol. 2003;21:1347–1355. doi: 10.1038/nbt895. [DOI] [PubMed] [Google Scholar]
- 14.Sun Z, et al. Graphene mode-locked ultrafast laser. ACS Nano. 2010;4:803–810. doi: 10.1021/nn901703e. [DOI] [PubMed] [Google Scholar]
- 15.Bao Q, et al. Atomic-layer graphene as a saturable absorber for ultrafast pulsed lasers. Adv Funct Mater. 2009;19:3077–3083. [Google Scholar]
- 16.Vasko FT. Saturation of interband absorption in graphene. Phys Rev B. 2010;82:245422. [Google Scholar]
- 17.Zitter RN. Saturated optical absorption through band filling in semiconductors. Appl Phys Lett. 1969;14:73–74. [Google Scholar]
- 18.Breusing M, Ropers C, Elsaesser T. Ultrafast carrier dynamics in graphite. Phys Rev Lett. 2009;102:086809. doi: 10.1103/PhysRevLett.102.086809. [DOI] [PubMed] [Google Scholar]
- 19.Wang H, et al. Ultrafast relaxation dynamics of hot optical phonons in graphene. Appl Phys Lett. 2010;96:081917–081913. [Google Scholar]
- 20.Rozhin AG, et al. Anisotropic saturable absorption of single-wall carbon nanotubes aligned in polyvinyl alcohol. Chem Phys Lett. 2005;405:288–293. [Google Scholar]
- 21.Avouris P, Freitag M, Perebeinos V. Carbon-nanotube photonics and optoelectronics. Nature Photon. 2008;2:341–350. [Google Scholar]
- 22.Baek IH, et al. Single-walled carbon nanotube saturable absorber assisted high-power mode-locking of a Ti:sapphire laser. Opt Express. 2011;19:7833–7838. doi: 10.1364/OE.19.007833. [DOI] [PubMed] [Google Scholar]
- 23.Singh CP, Bindra KS, Bhalerao GM, Oak SM. Investigation of optical limiting in iron oxide nanoparticles. Opt Express. 2008;16:8440–8450. doi: 10.1364/oe.16.008440. [DOI] [PubMed] [Google Scholar]
- 24.Irimpan L, Nampoori VPN, Radhakrishnan P. Spectral and nonlinear optical characteristics of ZnO nanocomposites. Sci Adv Mater. 2010;2:117–137. [Google Scholar]
- 25.Jain TK, Reddy MK, Morales MA, Leslie-Pelecky DL, Labhasetwar V. Biodistribution, clearance, and biocompatibility of iron oxide magnetic nanoparticles in rats. Mol Pharm. 2008;5:316–327. doi: 10.1021/mp7001285. [DOI] [PubMed] [Google Scholar]
- 26.Zhou J, Xu NS, Wang ZL. Dissolving behavior and stability of ZnO wires in biofluids: a study on biodegradability and biocompatibility of ZnO nanostructures. Adv Mater. 2006;18:2432–2435. [Google Scholar]
- 27.Terada Y, Yoshida S, Takeuchi O, Shigekawa H. Real-space imaging of transient carrier dynamics by nanoscale pump-probe microscopy. Nature Photon. 2010;4:869–874. [Google Scholar]
- 28.Hein B, Willi g KI, Hell SW. Stimulated emission depletion (STED) nanoscopy of a fluorescent protein-labeled organelle inside a living cell. Proc Natl Acad Sci USA. 2008;105:14271–14276. doi: 10.1073/pnas.0807705105. [DOI] [PMC free article] [PubMed] [Google Scholar]
- 29.Slipchenko MN, Oglesbee RA, Zhang D, Wu W, Cheng J-X. Heterodyne detected nonlinear optical imaging in a lock-in free manner. J Biophotonics. 2012:801–807. doi: 10.1002/jbio.201200005. [DOI] [PubMed] [Google Scholar]
- 30.Cao H, et al. Electronic transport in chemical vapor deposited graphene synthesized on Cu: Quantum Hall effect and weak localization. Appl Phys Lett. 2010;96:122106. [Google Scholar]
Associated Data
This section collects any data citations, data availability statements, or supplementary materials included in this article.


