
Figure 3. Suppression of pump-probe signal by saturation of electronic transition in graphene and graphite nano-platelets.
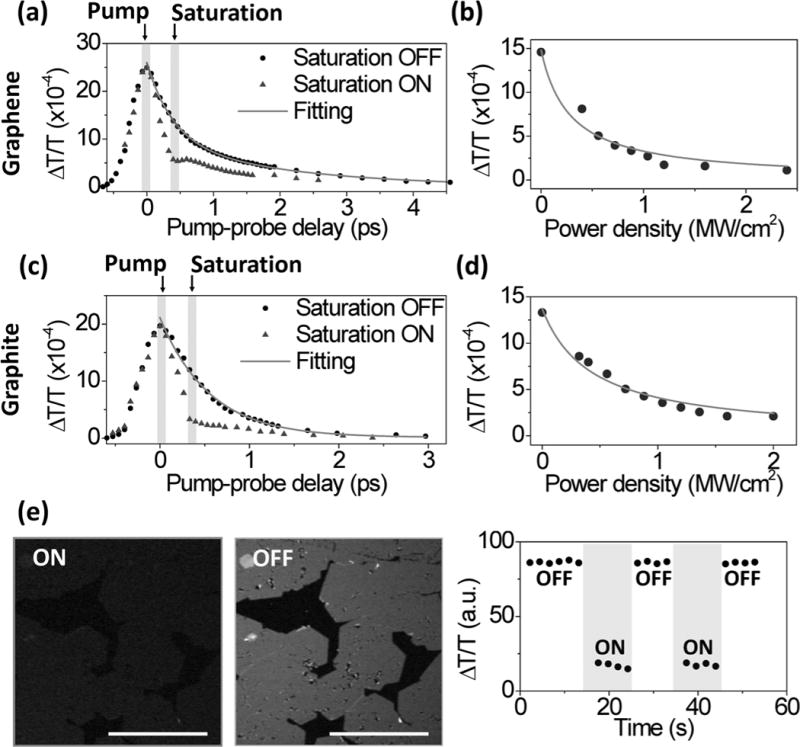
(a) Time-resolved transient absorption spectroscopy on graphene sample with (triangles) and without (circles) saturation beam. (b) The pump-probe signal as function of the peak power density of the saturation beam on graphene. The fit generates a saturation constant at 0.28 MW/cm2. (c-d) The same measurements as (a) and (b) but on graphite nano-platelets. (e) Transient absorption image of graphene with the saturation beam switched on (left panel) and off (middle panel). The average intensity of graphene was plotted as function of time (right panel). Scale bar: 20 μm.