Figure 4. Sub-diffraction-limit imaging of graphite nano-platelets.
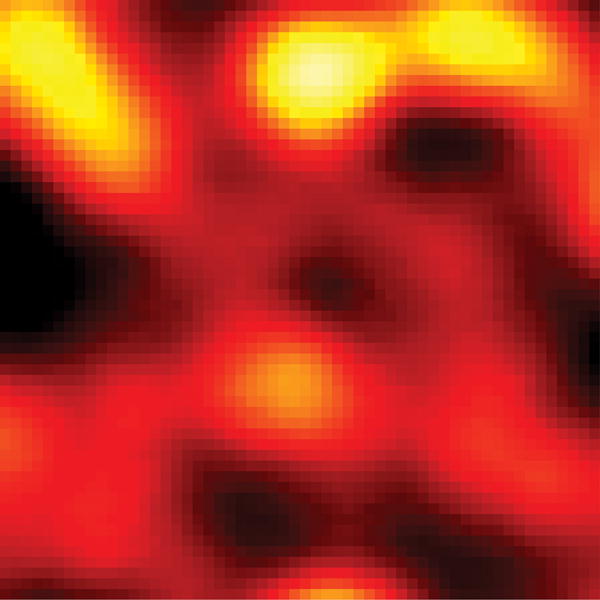
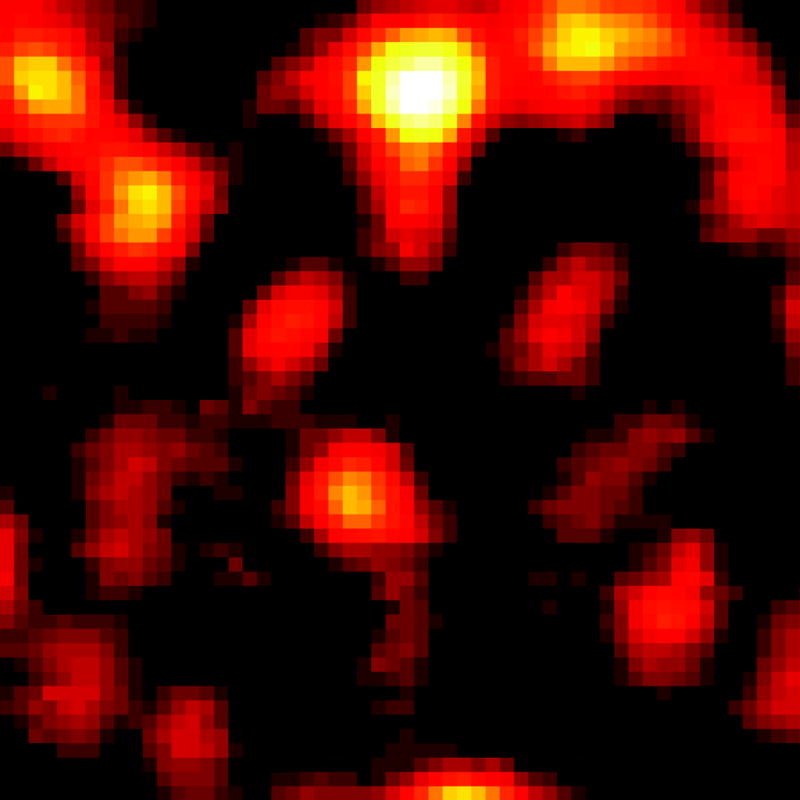
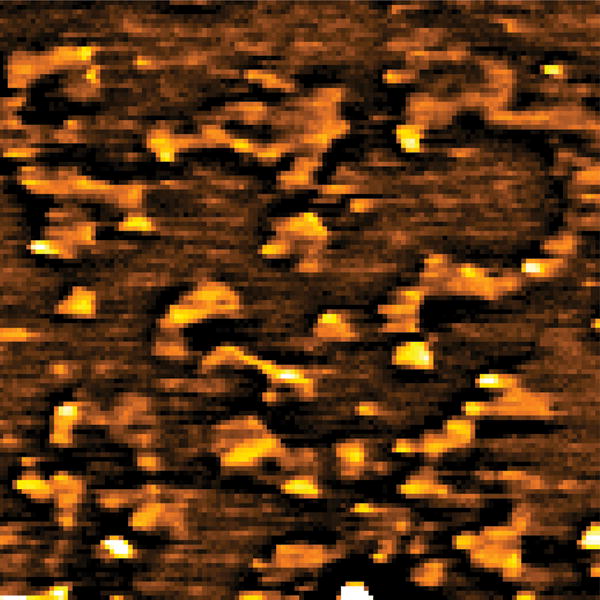
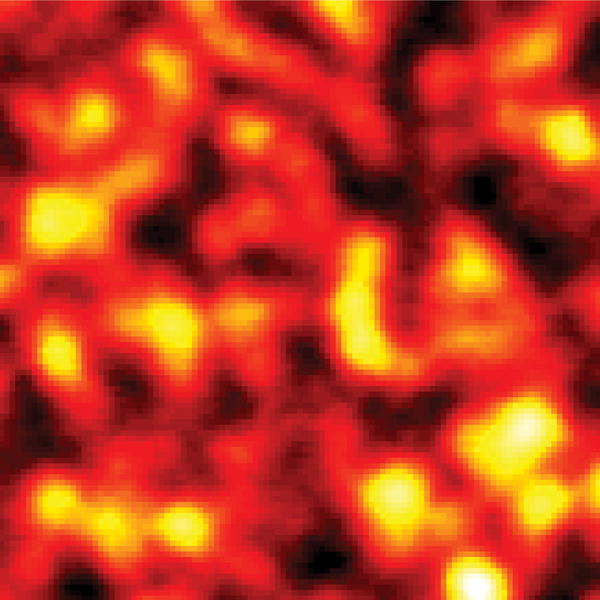
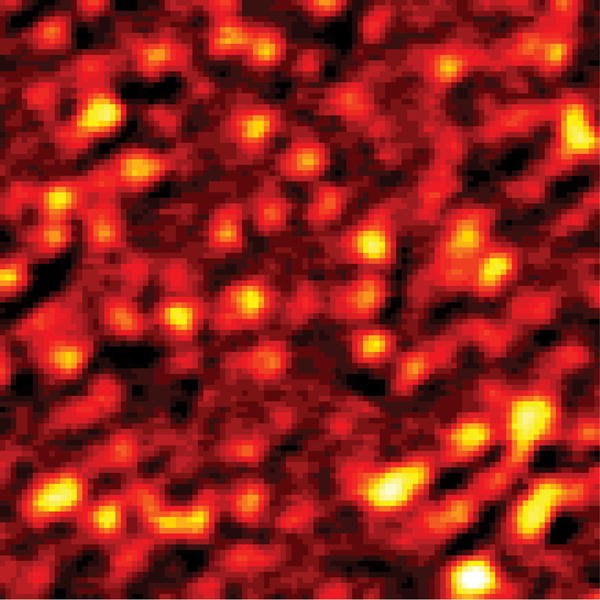
(a, d) Images by conventional pump-probe microscopy. (b, e) Images of the same areas by saturated transient absorption microscopy. (c) AFM images of the graphite nano-platelets. (f) Intensity profiles along the lines indicated by the arrows in (d) and (e). Solid curves represent Gaussian fitting. For comparison of resolution, the peak intensities were normalized to the same value. TA: transient absorption. Scale bar: 1 μm.
