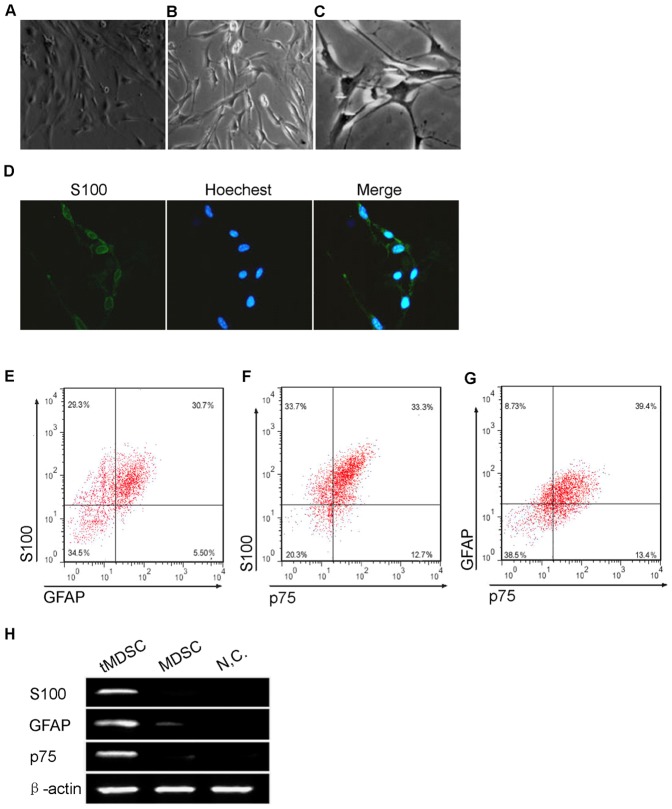
Figure 3. Transdifferentiation of mouse MDSCs to a Schwann cell phenotype.
(A) Phase-contrast micrographs showed that MDSCs adopted a spindle-like shape with processes which was a characteristic of Schwann cells after treatment with SC conditioned medium. (B) Immunocytochemisty showed that the tMDSCs highly expressed the SC marker S100 protein. (C) Flow cytometry assay demonstrated that the portion of S100, GFAP, and p75 positive cells in tMDSCs were 65.48±6.20%, 39.84±1.66% and 41.08±0.78%, and 25.86±5.37% of the tMDSCs expressed all of the three SC markers (data are mean % cells±S.E.M.). (D) Immunoblot assay showed the MDSCs expressed of S100, GFAP and p75 only after transdifferentiation. NC, negative control. β-actin served as loading control. Right, bar graph of qualitative data in statistics. S100, GFAP and p75 protein levels were normalized to that of β-actin, shown as mean±S.E.M. **, p<0.01 vs. MDSC.

