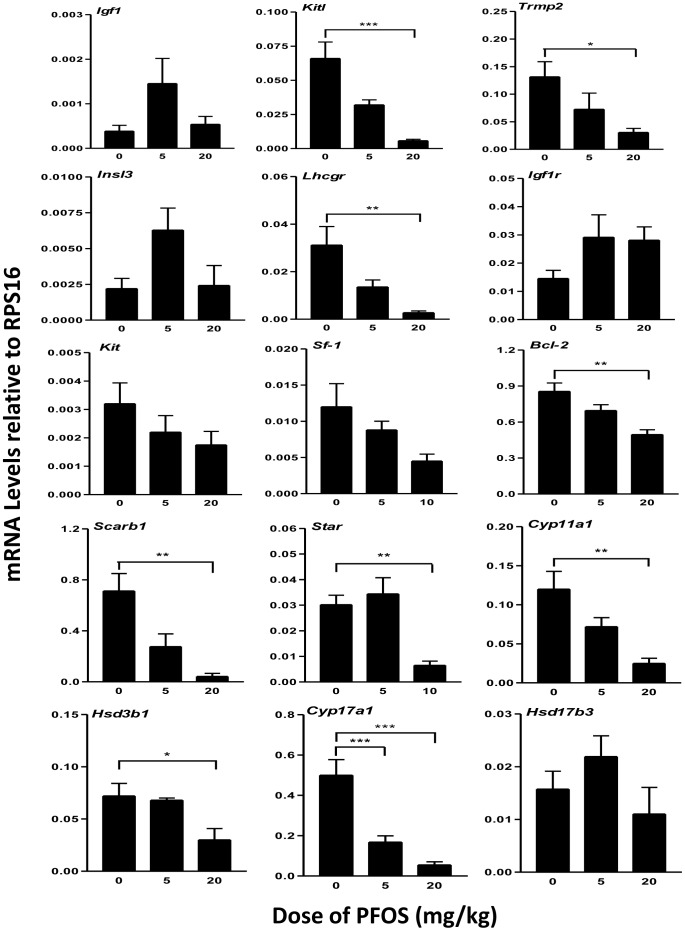
Figure 2. Real time PCR analysis of mRNAs in testis from GD20.5 after in utero PFOS exposures.
Pregnant dams were gavaged with 0, 5, or 20/kg PFOS from GD11 to GD19. Gene symbols and the function of their products are reported in Table S1, S2. Data are presented as mean ± SEM (n = 4). *,*** indicates significant difference compared to control (PFOS 0 mg/kg) was shown at, P<0.05, P<0.001, respectively.

