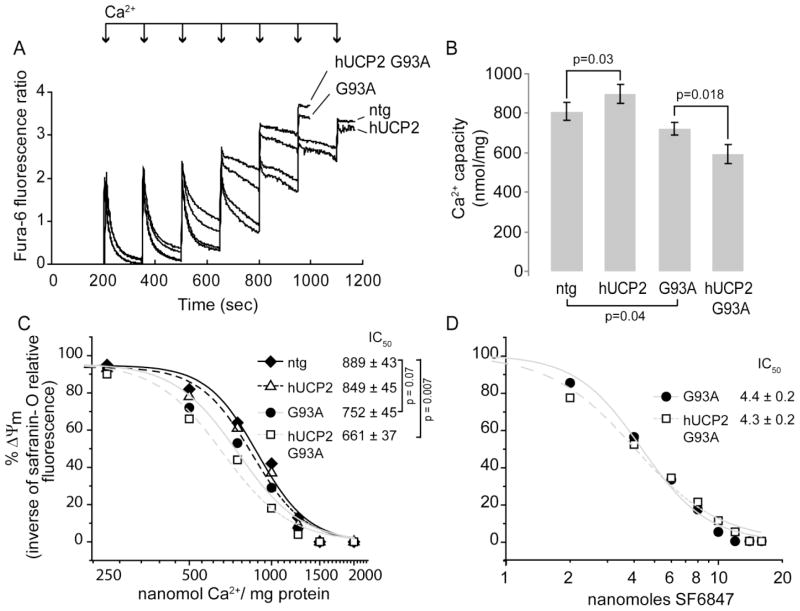
Figure 6. hUCP2 effects on mitochondrial Ca2+ uptake capacity and membrane potential.
(A) Kinetics of Ca2+ uptake in brain mitochondria measured by monitoring the change of Fura-6F fluorescence ratio (340/380 nm excitation, 510 nm emission) on Ca2+ loading (250 nmol of Ca2+/mg protein in each addition, indicated by arrows). The fluorescence peaks corresponds to increase in extra-mitochondrial Ca2+, whereas the decreases in fluorescence reflects mitochondrial Ca2+ uptake. The sustained increase at the end of trace shows that mitochondria are unable to further accumulate Ca2+. In the example, ntg and hUCP2 mitochondria took up six Ca2+ additions, whereas G93A and G93A hUCP2 mice mitochondria only took five Ca2+ additions. (B) Average brain mitochondrial Ca2+ uptake capacity in nmol Ca2+/mg of mitochondrial protein. Data are mean ± SEM of n = 5 brain mitochondria preparations per group. (C) Δψm response to 25 nmol Ca2+ bolus (250 nmol of Ca2+/mg protein) calculated as [(1/FLN nmol Ca2+)/(1/FL0 nmol Ca2+) × 100], where FLN is fluorescence of safranin-O at N nmol Ca2+. Safranin-O fluorescence inversely correlates with Δψm. Data are mean of n = 4 brain mitochondria preparations per group. (D) Δψm response to respiratory chain uncoupler SF6847 calculated as in C. Data are presented as mean of n =3 for hUCP2 and n = 4 for hUCP2 G93A. IC50values in C and D were calculated from the fitted curves of the Hill equation y=xn/(kn+xn), where x is Ca2+ or SF6847 concentration, n is the Hill coefficient, and k is the IC50 value

