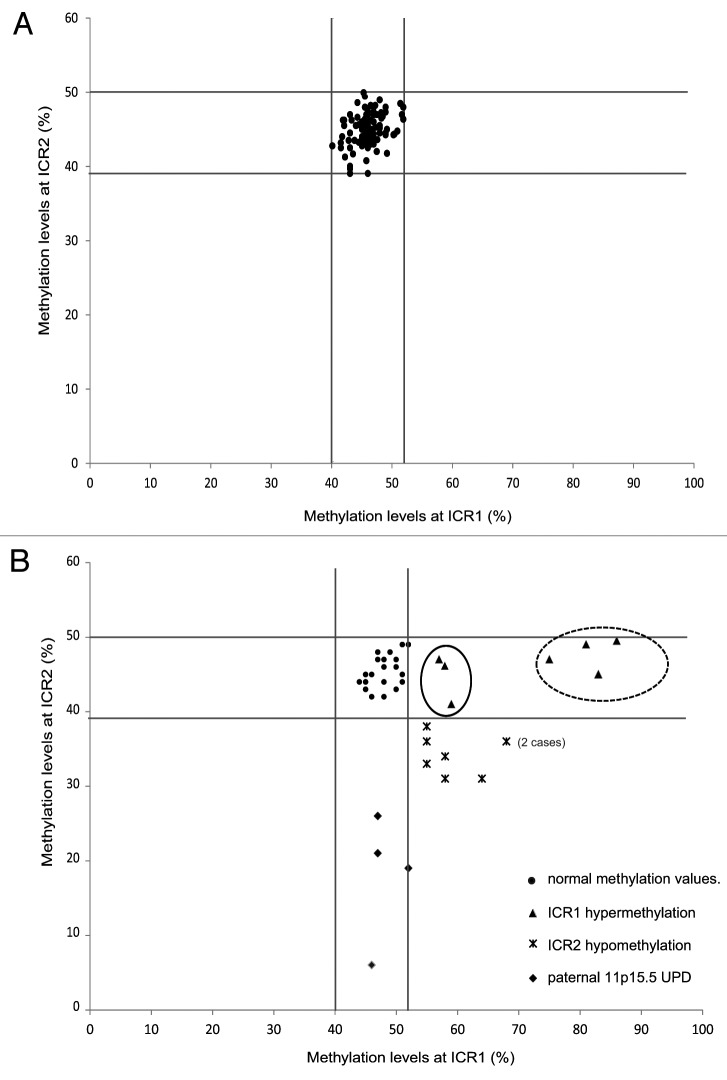
Figure 1. Distribution of ICR1 and ICR2 methylation values in the control population (A) and postnatal BWS cases (B). Vertical (ICR1) and horizontal (ICR2) lines define the threshold levels of normal methylation values. The cases (▲) with mild ICR1 hypermethylation associated with abdominal wall defects (umbilical hernia or diastasis recti), but not with omphalocele, are encircled by a solid line. The cases (▲) with severe ICR1 hypermethylation associated with macroglossia, macrosomia, and visceromegaly are encircled by a dotted line. Cases with ICR2 hypomethylation (♦). Cases with both ICR1 and ICR2 methylation anomalies, indicating UPD ()

An official website of the United States government
Here's how you know
Official websites use .gov
A
.gov website belongs to an official
government organization in the United States.
Secure .gov websites use HTTPS
A lock (
) or https:// means you've safely
connected to the .gov website. Share sensitive
information only on official, secure websites.
