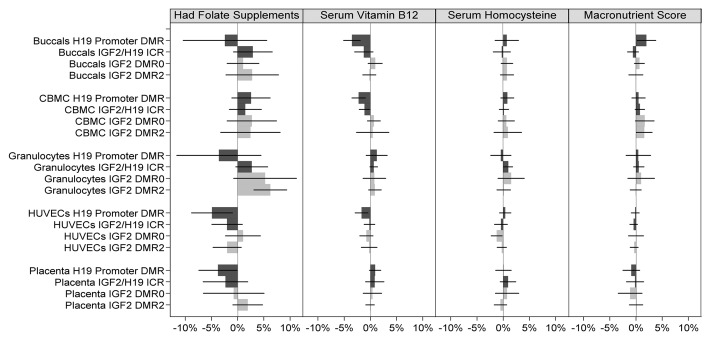
Figure 2. Association of IGF2/H19 methylation and nutrition factors across all cell types and DMRs. Light gray bars represent methylation changes in the IGF2 DMRs, and the dark gray bars represent changes in H19 DMRs. 95% confidence intervals of the coefficient change are represented by a horizontal black line through each bar. The mean methylation differences corresponding to serum vitamin B12, serum homocysteine, and macronutrient are for a 1 standard deviation increase in the respective factor’s z-score. Macronutrient score is obtained as the average of protein, carbohydrate and energy z-scores.

An official website of the United States government
Here's how you know
Official websites use .gov
A
.gov website belongs to an official
government organization in the United States.
Secure .gov websites use HTTPS
A lock (
) or https:// means you've safely
connected to the .gov website. Share sensitive
information only on official, secure websites.
