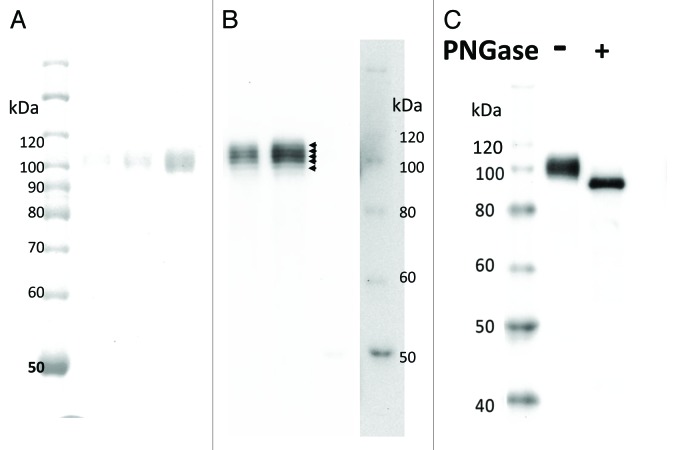
Figure 5. Glycoform analysis of pp-PA83 by SDS-PAGE and western blotting. Protein bands were visualized by Coomassie staining (A) and western blotting using pp-mAbPA (B). Separated bands are shown with arrowheads in (B). Western blot analysis of pp-PA83 with (+) and without (-) pre-treatment with PNGase F (C).

An official website of the United States government
Here's how you know
Official websites use .gov
A
.gov website belongs to an official
government organization in the United States.
Secure .gov websites use HTTPS
A lock (
) or https:// means you've safely
connected to the .gov website. Share sensitive
information only on official, secure websites.
