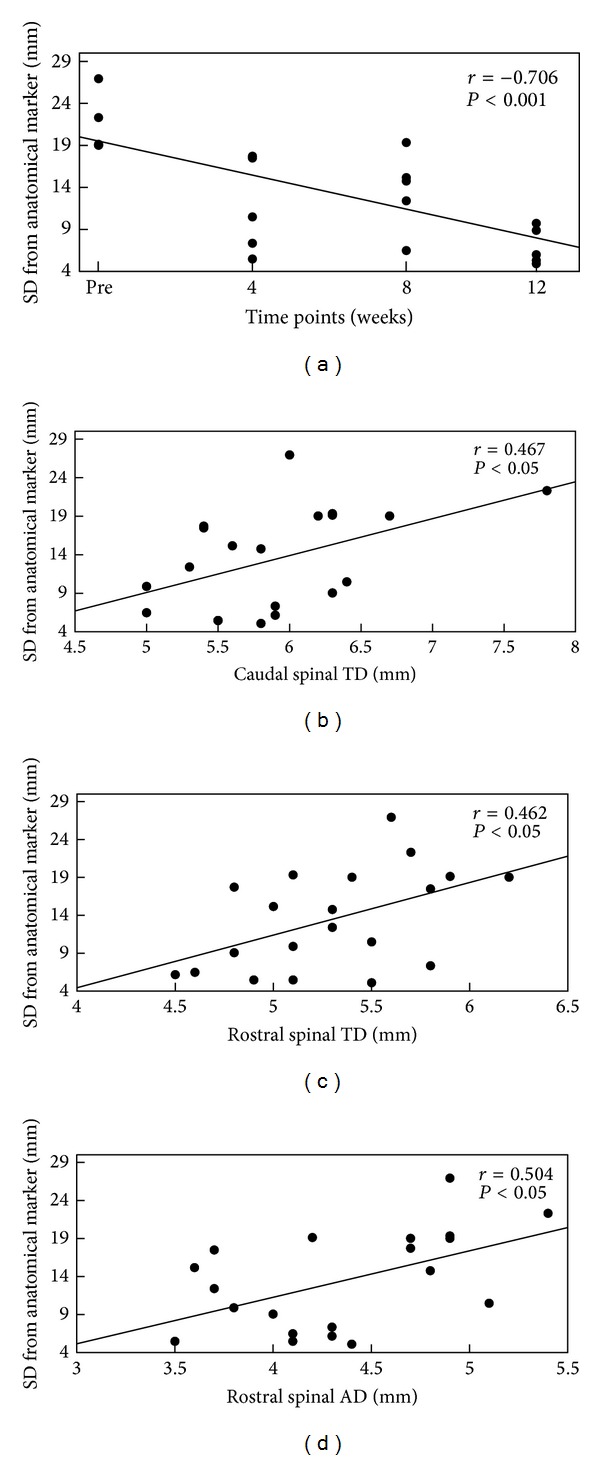
Figure 4.

Relationship between S1 cortical reorganization and time after lesion (a), caudal spinal cord TD (b), and rostral spinal cord TD (c) and AD (d): the linear correlation diagram of the average spatial distance (SD) between the maximum activation voxel of the posterior central gyrus opposite to the anatomic landmarks in all monkeys and the spinal cord diameter (along the x-axis). Smaller SD indicates a higher degree of S1 reorganization.
