
Figure 2. Comparison of TGF-β1 protein levels between AF and SR tissues.
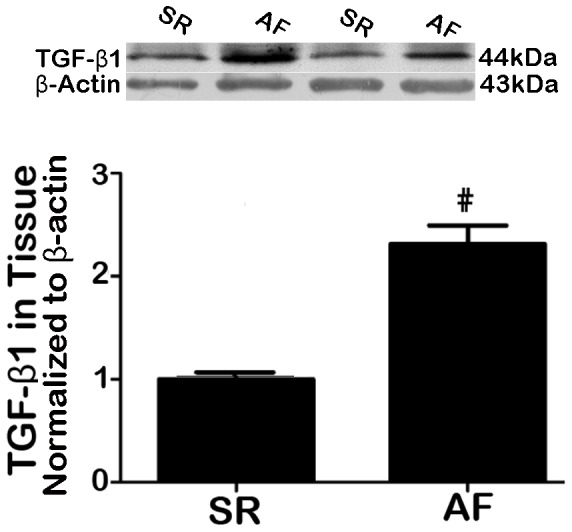
Upper panel: representative analog data of Western blot bands; lower panel: averaged analog data of Western blot bands (band density), normalized to β-actin. #P = 0.00 vs. SR, †P = 0.02 vs. SR; n = 10.