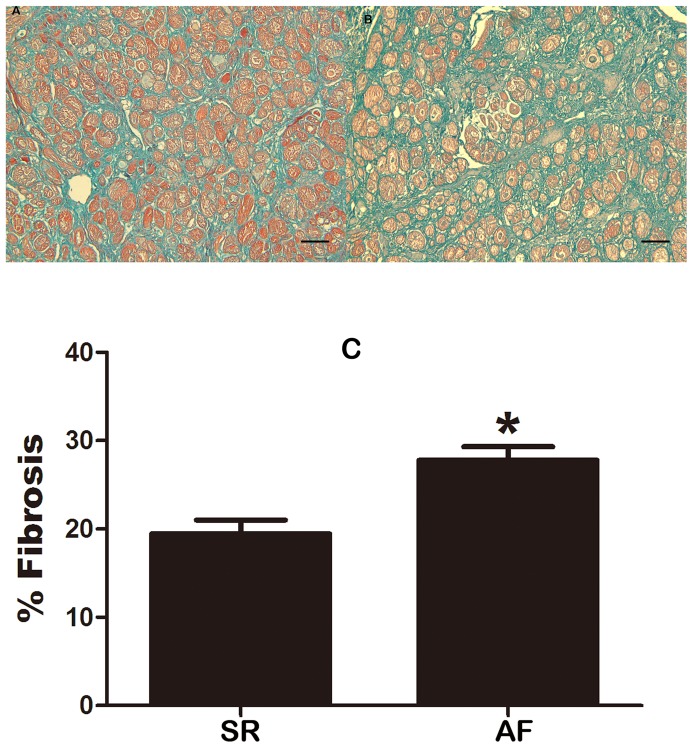
Figure 3. Comparison of atrial fibrosis between AF and SR subjects.
A, Masson-Trichrome staining sections showing the distribution of fibrosis in AF. B, Masson-Trichrome staining sections showing the distribution of fibrosis in SR. C, Percentage of fibrotic tissues quantified based on the Masson-Trichrome staining using Image-ProPlus. Note that the proportion of fibrosis was considerably greater in AF subjects than in SR subjects. SR, sinus rhythm; AF, atrial fibrillation. * P<0.001 vs. SR; n = 10. Scale bar = 100 µm. Magnification: ×200.

