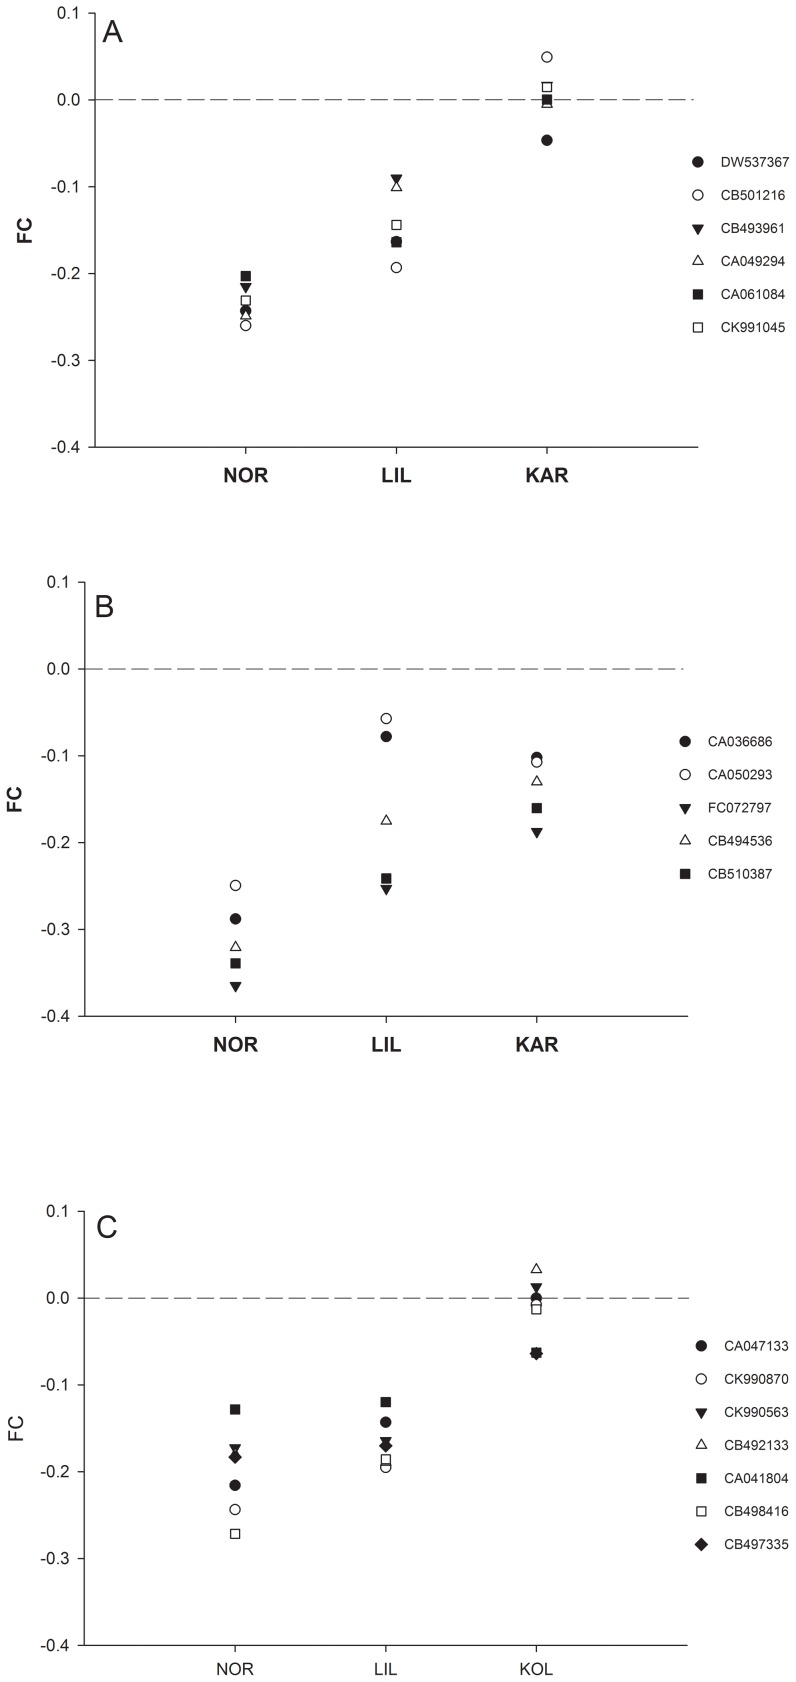
Figure 2. Expression of Hemoglobin genes.
Base 2 logarithms of the fold changes between the two temperatures for Hemoglobin genes with a significant population effect. a) Hemoglobin subunit alpha, b) Hemoglobin subunit beta, c) Hemoglobin subunit beta 1. A positive fold change indicates a higher level of expression at 5°C. The codes refer to Genbank accession numbers.

