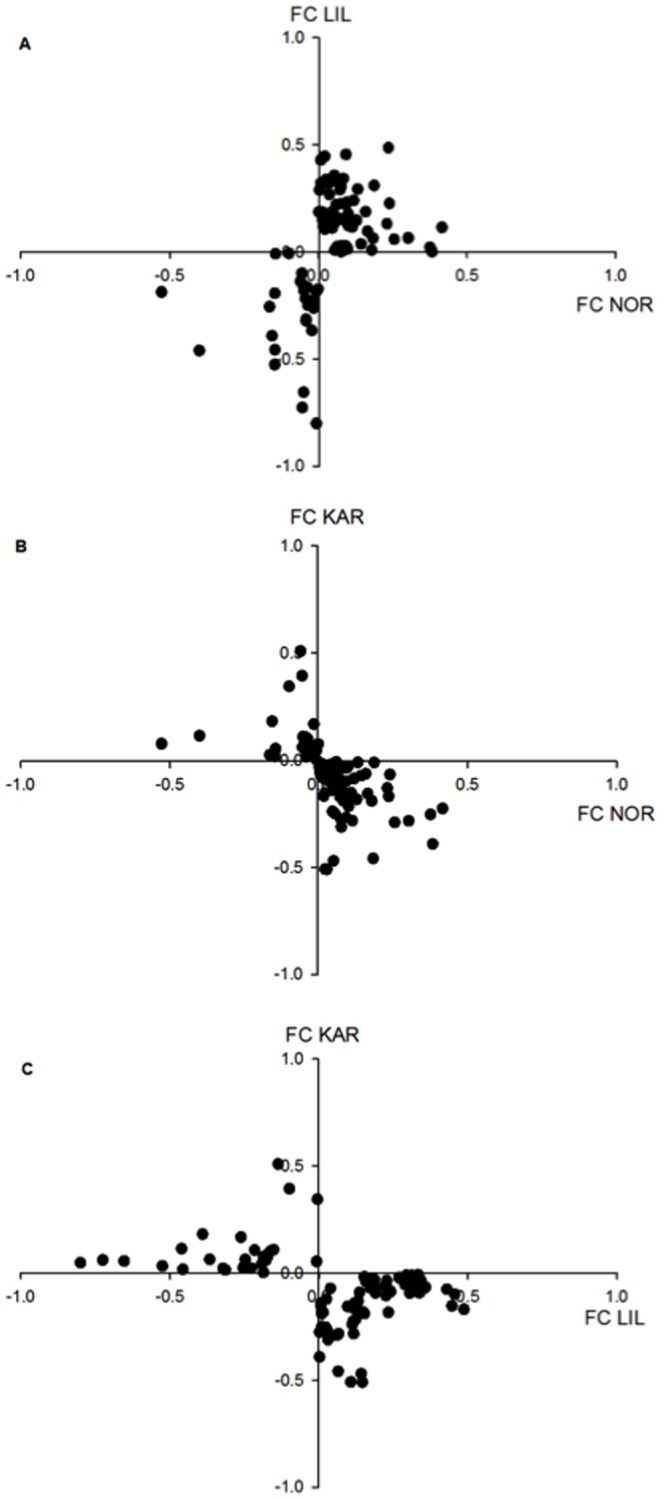
Figure 4. Changes in gene expression between temperatures.

Vector plot of base 2 logarithm of fold changes in gene expression between the two temperatures for each population. Each axis represents the fold change for one population. A positive value indicates a higher level of expression at 5°C. Only genes with an interaction effect that are differently expressed between KAR compared to NOR and LIL are plotted. a) Fold changes for NOR plotted against fold changes for LIL. b) Fold changes for NOR plotted against fold changes for KAR. c) Fold changes for LIL plotted against fold changes for KAR.
