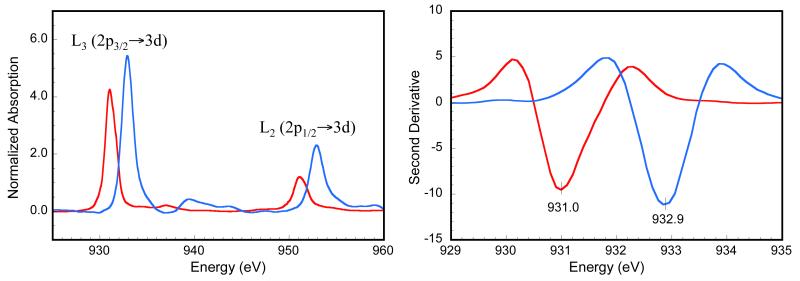
Figure 1.
Cu L-edge XAS spectra of 1 (red line) and 2 (blue line). (Left) Normalized Cu L-edge XAS spectra. The weak edge jumps were simulated with arctangent functions and subtracted from the entire spectrum. The intense peaks at ~930 and ~950 eV represent the L3-edge (2p3/2→3d transition) and the L2-edge (2p1/2→3d transition), respectively. (Right) Smoothed second derivative of the Cu L3-edge region.

